
Page 363 - AnnualEducationReport2018-19
P. 363
04/10/2019 Reason for Accountabili Overall EL General School Identificatio ty Status Index Value Participation Participation Quality/Stu n Index Value Index Value dent Success Index Value N/A N/A 9.46 N/A N/A 3.09 N/A N/A 76.85 N/A 100.00 92.77 N/A N/A 91.08 N/A 100.00 78.75 N/A N/A 68.05 N/A 100.00 92.30 N/A N/A 81.73 85.21 99.92 87.09 N/A N/A 90.78 N/A 100.00 99.60 N/A N/A N/A N/A N/A N/A N/A N/A 99.58 95.40 100.00 97.92 N/A N/A 94.95 61.92 99.95 99.48 Page 185 of 613
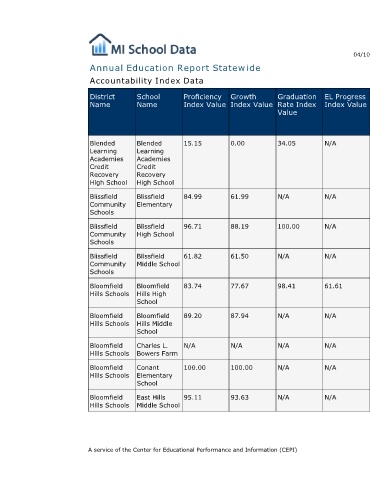
EL Progress Index Value N/A N/A N/A N/A 61.61 N/A N/A N/A N/A
Graduation Rate Index Value 34.05 N/A 100.00 N/A 98.41 N/A N/A N/A N/A
Annual Education Report Statewide
Growth Index Value 0.00 61.99 88.19 61.50 77.67 87.94 N/A 100.00 93.63
Proficiency Index Value 15.15 84.99 96.71 61.82 83.74 89.20 N/A 100.00 95.11 A service of the Center for Educational Performance and Information (CEPI)
Accountability Index Data
School Name Blended Learning Academies Credit Recovery High School Blissfield Elementary Blissfield High School Blissfield Middle School Bloomfield Hills High School Bloomfield Hills Middle School Charles L. Bowers Farm Conant Elementary School East Hills Middle School
District Name Blended Learning Academies Credit Recovery High School Blissfield Community Schools Blissfield Community Schools Blissfield Community Schools Bloomfield Hills Schools Bloomfield Hills Schools Bloomfield Hills Schools Bloomfield Hills Schools Bloomfield Hills Schools