
Page 421 - AnnualEducationReport2018-19
P. 421
04/10/2019 Reason for Accountabili Overall EL General School Identificatio ty Status Index Value Participation Participation Quality/Stu n Index Value Index Value dent Success Index Value N/A N/A 81.16 N/A N/A 81.16 N/A N/A 12.54 N/A N/A 38.33 N/A N/A 73.07 N/A 100.00 85.37 N/A N/A 97.39 N/A 100.00 83.39 N/A N/A 83.20 N/A N/A 83.20 N/A N/A 91.78 N/A 100.00 94.21 N/A N/A N/A N/A N/A N/A N/A N/A 86.24 N/A 99.86 82.11 N/A N/A 87.46 N/A 100.00 78.57 Page 214 of 613
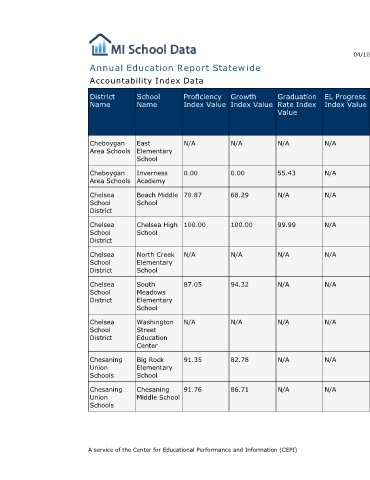
EL Progress Index Value N/A N/A N/A N/A N/A N/A N/A N/A N/A
Graduation Rate Index Value N/A 55.43 N/A 99.99 N/A N/A N/A N/A N/A
Annual Education Report Statewide
Growth Index Value N/A 0.00 68.29 100.00 N/A 94.32 N/A 82.78 86.71
Proficiency Index Value N/A 0.00 70.87 100.00 N/A 87.05 N/A 91.35 91.76 A service of the Center for Educational Performance and Information (CEPI)
Accountability Index Data
School Name East Elementary School Inverness Academy Beach Middle School Chelsea High School North Creek Elementary School South Meadows Elementary School Washington Street Education Center Big Rock Elementary School Chesaning Middle School
District Name Cheboygan Area Schools Cheboygan Area Schools Chelsea School District Chelsea School District Chelsea School District Chelsea School District Chelsea School District Chesaning Union Schools Chesaning Union Schools