
Page 425 - AnnualEducationReport2018-19
P. 425
04/10/2019 Reason for Accountabili Overall EL General School Identificatio ty Status Index Value Participation Participation Quality/Stu n Index Value Index Value dent Success Index Value N/A N/A 81.30 100.00 100.00 88.33 N/A N/A 93.61 99.41 99.24 89.87 N/A N/A 12.21 N/A 95.06 15.98 N/A N/A 68.31 100.00 100.00 85.16 N/A N/A 66.26 N/A 100.00 78.29 N/A N/A 78.00 100.00 100.00 88.83 N/A N/A 72.24 100.00 100.00 92.93 N/A N/A 81.09 100.00 100.00 90.38 N/A N/A 91.25 100.00 100.00 87.78 Page 216 of 613
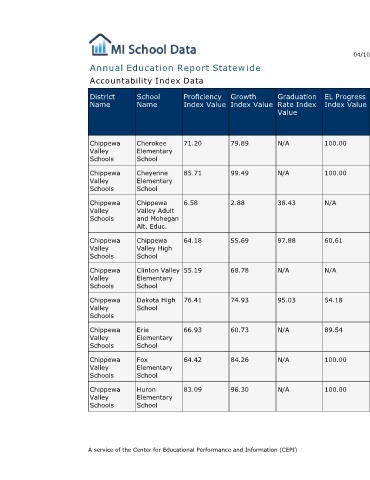
EL Progress Index Value 100.00 100.00 N/A 60.61 N/A 54.18 89.54 100.00 100.00
Graduation Rate Index Value N/A N/A 38.43 97.88 N/A 95.03 N/A N/A N/A
Annual Education Report Statewide
Growth Index Value 79.89 99.49 2.88 55.69 68.78 74.93 60.73 84.26 96.30
Proficiency Index Value 71.20 85.71 6.58 64.18 55.19 76.41 66.93 64.42 83.09 A service of the Center for Educational Performance and Information (CEPI)
Accountability Index Data
School Name Cherokee Elementary School Cheyenne Elementary School Chippewa Valley Adult and Mohegan Alt. Educ. Chippewa Valley High School Clinton Valley Elementary School Dakota High School Erie Elementary School Fox Elementary School Huron Elementary School
District Name Chippewa Valley Schools Chippewa Valley Schools Chippewa Valley Schools Chippewa Valley Schools Chippewa Valley Schools Chippewa Valley Schools Chippewa Valley Schools Chippewa Valley Schools Chippewa Valley Schools