
Page 427 - AnnualEducationReport2018-19
P. 427
04/10/2019 Reason for Accountabili Overall EL General School Identificatio ty Status Index Value Participation Participation Quality/Stu n Index Value Index Value dent Success Index Value N/A N/A 100.00 N/A 100.00 100.00 N/A N/A 70.30 100.00 100.00 88.44 N/A N/A 68.79 100.00 100.00 88.32 N/A N/A 84.22 100.00 100.00 95.23 N/A N/A 85.86 100.00 100.00 91.91 N/A N/A 72.26 N/A 100.00 88.83 N/A N/A 75.14 100.00 100.00 89.42 N/A N/A 91.10 100.00 100.00 94.31 N/A N/A 91.73 100.00 100.00 93.70 N/A N/A 72.60 100.00 99.97 86.67 Page 217 of 613
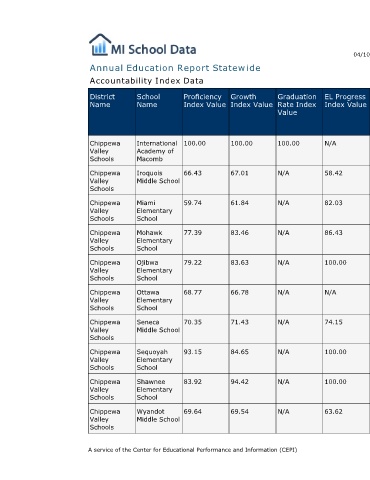
EL Progress Index Value N/A 58.42 82.03 86.43 100.00 N/A 74.15 100.00 100.00 63.62
Graduation Rate Index Value 100.00 N/A N/A N/A N/A N/A N/A N/A N/A N/A
Annual Education Report Statewide
Growth Index Value 100.00 67.01 61.84 83.46 83.63 66.78 71.43 84.65 94.42 69.54
Proficiency Index Value 100.00 66.43 59.74 77.39 79.22 68.77 70.35 93.15 83.92 69.64 A service of the Center for Educational Performance and Information (CEPI)
Accountability Index Data
School Name International Academy of Macomb Iroquois Middle School Miami Elementary School Mohawk Elementary School Ojibwa Elementary School Ottawa Elementary School Seneca Middle School Sequoyah Elementary School Shawnee Elementary School Wyandot Middle School
District Name Chippewa Valley Schools Chippewa Valley Schools Chippewa Valley Schools Chippewa Valley Schools Chippewa Valley Schools Chippewa Valley Schools Chippewa Valley Schools Chippewa Valley Schools Chippewa Valley Schools Chippewa Valley Schools