
Page 424 - AnnualEducationReport2018-19
P. 424
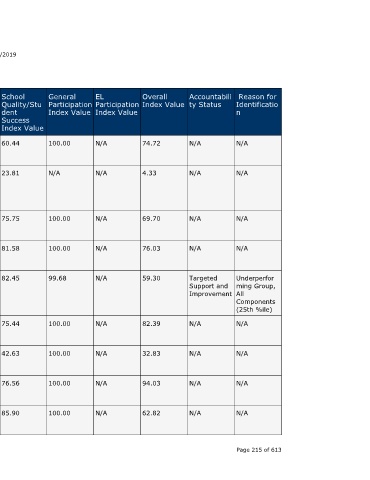
Reason for  Identificatio  n  N/A  N/A  N/A      N/A       Underperfor  ming Group,  All  Components  (25th %ile)  N/A  N/A  N/A  N/A  Page 215 of 613


                                  Accountabili  ty Status  N/A  N/A       N/A       N/A       Targeted  Support and  Improvement  N/A  N/A  N/A  N/A


                                  Overall  Index Value  74.72  4.33       69.70     76.03     59.30          82.39    32.83     94.03     62.82


                                    Participation  Index Value


                                  EL             N/A       N/A            N/A       N/A       N/A            N/A      N/A       N/A       N/A


                                  General  Participation  Index Value  100.00  N/A  100.00  100.00  99.68    100.00   100.00    100.00    100.00


                    04/10/2019    School  Quality/Stu  dent  Success  Index Value  60.44  23.81  75.75  81.58  82.45  75.44  42.63  76.56  85.90


                                  EL Progress  Index Value  N/A  N/A      N/A       N/A       N/A            N/A      N/A       N/A       N/A


                                  Graduation  Rate Index  Value  92.57  N/A  N/A    92.60     N/A            N/A      24.95     N/A       N/A


                        Annual Education Report Statewide
                                  Growth  Index Value  69.31  0.00        59.06     68.36     52.31          85.82    31.71     97.58     57.25


                                  Proficiency  Index Value  80.05  0.00   77.17     74.98     53.55          80.49    27.51     97.88     55.66       A service of the Center for Educational Performance and Information (CEPI)


                             Accountability Index Data


                                  School  Name   Chesaning  Union High  School  Chesaning  Union  Schools  Alternative  Education  Barryton  Elementary  School  Chippewa  Hills High  School  Chippewa  Hills  Intermediate  School  Mecosta  Elementary  School  Mosaic  School  Weidman  Elementary  School  Algonquin  Middle School


                                  District  Name  Chesaning  Union  Schools  Chesaning  Union  Schools  Chippewa  Hills School  District  Chippewa  Hills School  District  Chippewa  Hills School  District  Chippewa  Hills School  District  Chippewa  Hills School  District  Chippewa  Hills School  District  Chippewa  Valley  Schools