
Page 95 - AnnualEducationReport2018-19
P. 95
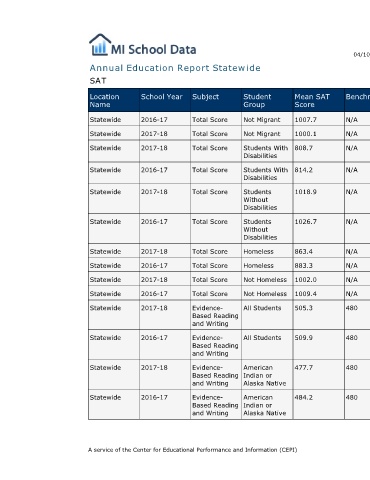
04/10/2019    Number % Did Not Did Not Meet % Met or  Met or Benchmark  Assessed  Meet Exceeded Exceeded  105,856  65.0%  68,859  35.0%  36,997  N/A  105,075  65.4%  68,670  34.6%  36,405  N/A  9,416  95.4%  8,984  4.6%  432  N/A  9,525  95.5%  9,094  4.5%  431  N/A  95,717  62.4%  59,740  37.6%  35,977  N/A  96,380 62.1% 59,810  37.9% 36,570  N/A  1,444  90.4%  1,306  9.6%  138  N/A  1,549  88.1%  1,365  11.9%  184  N/A  103,689  65.0%  67,418  35.0%  36,271  N/A  104,356  64.7%  67,539  35.3%  36,817  N/A  105,133  42.2%  44,376  57.8%  60,757  480  105,905  39.7%  42,060  60.3%  63,845  480  636  52.8%


                                  Mean SAT  Score  1007.7  1000.1  808.7  814.2  1018.9  1026.7  863.4  883.3  1002.0  1009.4  505.3  509.9  477.7  484.2


                                  Student  Group  Not Migrant  Not Migrant  Students With  Disabilities  Students With  Disabilities  Students  Without  Disabilities  Students  Without  Disabilities  Homeless  Homeless  Not Homeless  Not Homeless  All Students  All Students  American  Indian or  Alaska Native  American  Indian or  Alaska Native
                        Annual Education Report Statewide


                                  Subject  Total Score  Total Score  Total Score  Total Score  Total Score  Total Score  Total Score  Total Score  Total Score  Total Score  Evidence-  Based Reading  and Writing  Evidence-  Based Reading  and Writing  Evidence-  Based Reading  and Writing  Evidence-  Based Reading  and Writing A service of the Center for Educational Performance and Information (CEPI)


                                  School Year  2016-17  2017-18  2017-18  2016-17  2017-18  2016-17  2017-18  2016-17  2017-18  2016-17  2017-18  2016-17  2017-18  2016-17


                             SAT  Location  Name  Statewide  Statewide  Statewide  Statewide  Statewide  Statewide  Statewide  Statewide  Statewide  Statewide  Statewide  Statewide  Statewide  Statewide