
Page 91 - AnnualEducationReport2018-19
P. 91
04/10/2019 Number % Did Not Did Not Meet % Met or Met or Benchmark Assessed Meet Exceeded Exceeded 105,133 65.4% 68,724 34.6% 36,409 N/A 105,905 65.1% 68,904 34.9% 37,001 N/A 636 77.8% 495 22.2% 141 N/A 674 79.1% 533 20.9% 141 N/A 3,769 36.7% 1,382 63.3% 2,387 N/A 3,834 36.3% 1,392 63.7% 2,442 N/A 15,848 91.0% 14,420 9.0% 1,428 N/A 16,525 90.9% 15,026 9.1% 1,499 N/A 7,161 80.4% 5,754 19.6% 1,407 N/A 6,731 81.2% 5,463 18.8% 1,268 N/A 91 63.7% 58 36.3% 33 N/A 132 60.6% 80 39.4% 52 N/A 2,957 69.0% 2,040 31.0% 917 N/A Page 46
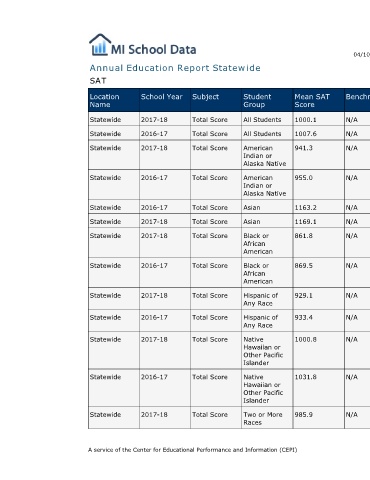
Mean SAT Score 1000.1 1007.6 941.3 955.0 1163.2 1169.1 861.8 869.5 929.1 933.4 1000.8 1031.8 985.9
Student Group All Students All Students American Indian or Alaska Native American Indian or Alaska Native Asian Asian Black or African American Black or African American Hispanic of Any Race Hispanic of Any Race Native Hawaiian or Other Pacific Islander Native Hawaiian or Other Pacific Islander Two or More Races
Annual Education Report Statewide
Subject Total Score Total Score Total Score Total Score Total Score Total Score Total Score Total Score Total Score Total Score Total Score Total Score Total Score A service of the Center for Educational Performance and Information (CEPI)
School Year 2017-18 2016-17 2017-18 2016-17 2016-17 2017-18 2017-18 2016-17 2017-18 2016-17 2017-18 2016-17 2017-18
SAT Location Name Statewide Statewide Statewide Statewide Statewide Statewide Statewide Statewide Statewide Statewide Statewide Statewide Statewide