
Page 93 - AnnualEducationReport2018-19
P. 93
04/10/2019 Number % Did Not Did Not Meet % Met or Met or Benchmark Assessed Meet Exceeded Exceeded 2,807 68.3% 1,916 31.7% 891 N/A 74,606 59.7% 44,565 40.3% 30,041 N/A 75,267 59.1% 44,504 40.9% 30,763 N/A 52,471 66.6% 34,934 33.4% 17,537 N/A 53,143 66.4% 35,272 33.6% 17,871 N/A 52,662 64.2% 33,790 35.8% 18,872 N/A 52,762 63.7% 33,632 36.3% 19,130 N/A 44,743 82.8% 37,062 17.2% 7,681 N/A 39,424 84.0% 33,116 16.0% 6,308 N/A 60,390 52.4% 31,662 47.6% 28,728 N/A 66,481 53.8% 35,788 46.2% 30,693 N/A 3,832 92.7% 3,552 7.3% 280 N/A 4,336 9
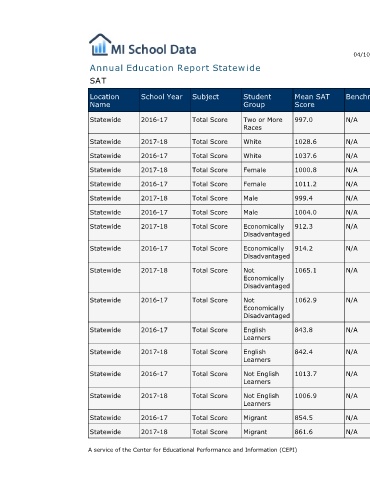
Mean SAT Score 997.0 1028.6 1037.6 1000.8 1011.2 999.4 1004.0 912.3 914.2 1065.1 1062.9 843.8 842.4 1013.7 1006.9 854.5 861.6
Student Group Two or More Races White White Female Female Male Male Economically Disadvantaged Economically Disadvantaged Not Economically Disadvantaged Not Economically Disadvantaged English Learners English Learners Not English Learners Not English Learners Migrant Migrant
Annual Education Report Statewide
Subject Total Score Total Score Total Score Total Score Total Score Total Score Total Score Total Score Total Score Total Score Total Score Total Score Total Score Total Score Total Score Total Score Total Score A service of the Center for Educational Performance and Information (CEPI)
School Year 2016-17 2017-18 2016-17 2017-18 2016-17 2017-18 2016-17 2017-18 2016-17 2017-18 2016-17 2016-17 2017-18 2016-17 2017-18 2016-17 2017-18
SAT Location Name Statewide Statewide Statewide Statewide Statewide Statewide Statewide Statewide Statewide Statewide Statewide Statewide Statewide Statewide Statewide Statewide Statewide