
Page 88 - AnnualEducationReport2018-19
P. 88
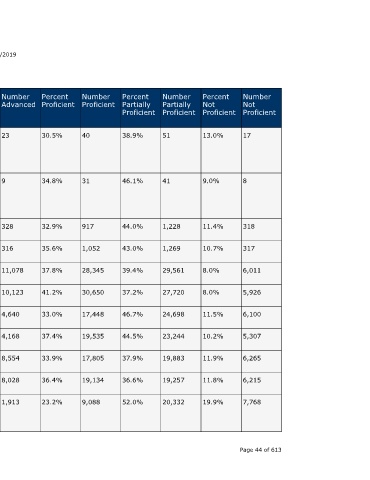
Number  Not  Proficient  17  8            318     317    6,011  5,926  6,100   5,307  6,265  6,215  7,768           Page 44 of 613


                                  Percent  Not  Proficient  13.0%  9.0%     11.4%   10.7%  8.0%   8.0%   11.5%   10.2%  11.9%  11.8%  19.9%


                                  Number  Partially  Proficient  51  41     1,228   1,269  29,561  27,720  24,698  23,244  19,883  19,257  20,332


                                  Percent  Partially  Proficient  38.9%  46.1%  44.0%  43.0%  39.4%  37.2%  46.7%  44.5%  37.9%  36.6%  52.0%


                                  Number  Proficient  40     31             917     1,052  28,345  30,650  17,448  19,535  17,805  19,134  9,088


                                  Percent  Proficient  30.5%  34.8%         32.9%   35.6%  37.8%  41.2%  33.0%   37.4%  33.9%  36.4%  23.2%


                    04/10/2019    Number  Advanced  23       9              328     316    11,078  10,123  4,640  4,168  8,554  8,028  1,913


                                  Percent  Advanced  17.6%   10.1%          11.8%   10.7%  14.8%  13.6%  8.8%    8.0%   16.3%  15.3%  4.9%


                                  State  Number  Students  Proficient  63  40  1,245  1,368  39,423  40,773  22,088  23,703  26,359  27,162  11,001


                                  State  Percent  Students  Proficient  48.1%  44.9%  44.6%  46.3%  52.6%  54.8%  41.8%  45.4%  50.2%  51.6%  28.1%
                        Annual Education Report Statewide


                                  School  Year  2016-17      2017-18        2016-17  2017-18  2016-17  2017-18  2016-17  2017-18  2016-17  2017-18  2016-17


                                  Testing  Group  Native  Hawaiian  or Other  Pacific  Islander  Native  Hawaiian  or Other  Pacific  Islander  Two or  More Races  Two or  More Races  White  White  Female  Female  Male  Male  Economicall  y  Disadvanta  ged A service of the Center for Educational Performance and Information (CEPI)


                             M-STEP Grades 3-11  Grade  Subject  11th Grade  Social  Content  Studies  11th Grade  Social  Content  Studies  11th Grade  Social  Content  Studies  11th Grade  Social  Content Studies  11th Grade  Social  Content  Studies  11th Grade  Social  Content  Studies  11th Grade  Social  Content  Studies  11th Grade  Social  Content  Studies  11th Grade  Social  Content  Studies  11th Grade  Social  Content  Studies  11th Grade  Social  Content  Studies