
Page 89 - AnnualEducationReport2018-19
P. 89
04/10/2019 Number Percent Number Percent Number Percent Number Not Not Partially Partially Proficient Proficient Advanced Proficient Proficient Proficient Proficient 7,777 17.4% 22,373 50.1% 12,219 27.4% 2,270 1,434 36.8% 2,062 53.0% 358 9.2% 38 1,508 34.2% 2,416 54.7% 461 10.4% 30 15 30.6% 28 57.1% 6 12.2% 0 16 26.2% 30 49.2% 15 24.6% 0 3,059 32.5% 4,897 52.0% 1,180 12.5% 282 3,012 31.8% 4,932 52.1% 1,282 13.5% 249 307 21.2% 787 54.2% 321 22.1% 36 108 28.0% 204 52.8% 69 17.9% 5 9 6.9% 55 42.0% 49 37.4% 18 Page 45 of 613
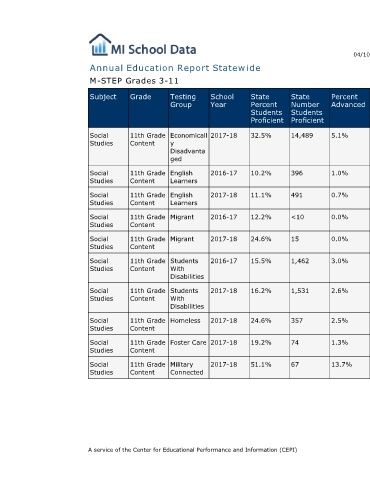
Percent Advanced 5.1% 1.0% 0.7% 0.0% 0.0% 3.0% 2.6% 2.5% 1.3% 13.7%
State Number Students Proficient 14,489 396 491 <10 15 1,462 1,531 357 74 67
State Percent Students Proficient 32.5% 10.2% 11.1% 12.2% 24.6% 15.5% 16.2% 24.6% 19.2% 51.1%
Annual Education Report Statewide
School Year 2017-18 2016-17 2017-18 2016-17 2017-18 2016-17 2017-18 2017-18 2017-18 2017-18
Testing Group Economicall y Disadvanta ged English Learners English Learners Migrant Migrant Students With Disabilities Students With Disabilities Homeless Foster Care Military Connected A service of the Center for Educational Performance and Information (CEPI)
M-STEP Grades 3-11 Grade Subject 11th Grade Social Content Studies 11th Grade Social Content Studies 11th Grade Social Content Studies 11th Grade Social Content Studies 11th Grade Social Content Studies 11th Grade Social Content Studies 11th Grade Social Content Studies 11th Grade Social Content Studies 11th Grade Social Content Studies 11th Grade Social Content Studies