
Page 86 - AnnualEducationReport2018-19
P. 86
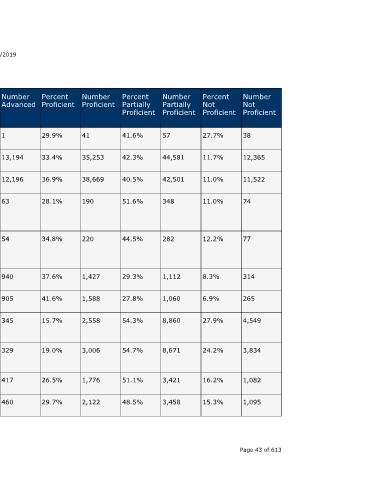
Number  Not  Proficient  38  12,365  11,522  74  77        314    265     4,549    3,834     1,082  1,095           Page 43 of 613


                                  Percent  Not  Proficient  27.7%  11.7%  11.0%  11.0%  12.2%  8.3%  6.9%   27.9%    24.2%     16.2%  15.3%


                                  Number  Partially  Proficient  57  44,581  42,501  348  282  1,112  1,060  8,860   8,671     3,421  3,458


                                  Percent  Partially  Proficient  41.6%  42.3%  40.5%  51.6%  44.5%  29.3%  27.8%  54.3%  54.7%  51.1%  48.5%


                                  Number  Proficient  41  35,253  38,669  190    220         1,427  1,588   2,558    3,006     1,776  2,122


                                  Percent  Proficient  29.9%  33.4%  36.9%  28.1%  34.8%     37.6%  41.6%   15.7%    19.0%     26.5%  29.7%


                    04/10/2019    Number  Advanced  1  13,194  12,196  63        54          940    905     345      329       417    460


                                  Percent  Advanced  0.7%  12.5%  11.6%  9.3%    8.5%        24.8%  23.7%   2.1%     2.1%      6.2%   6.4%


                                  State  Number  Students  Proficient  42  48,447  50,865  253  274  2,367  2,493  2,903  3,335  2,193  2,582


                                  State  Percent  Students  Proficient  30.7%  46.0%  48.5%  37.5%  43.3%  62.4%  65.3%  17.8%  21.1%  32.8%  36.2%
                        Annual Education Report Statewide


                                  School  Year  2017-18  2016-17  2017-18  2016-17  2017-18  2016-17  2017-18  2016-17  2017-18  2016-17  2017-18


                                  Testing  Group  Military  Connected  All  Students  All  Students  American  Indian or  Alaska  Native  American  Indian or  Alaska  Native  Asian  Asian  Black or  African  American  Black or  African  American  Hispanic of  Any Race  Hispanic of  Any Race  A service of the Center for Educational Performance and Information (CEPI)


                             M-STEP Grades 3-11  Grade  Subject  8th Grade  Social  Content  Studies  11th Grade  Social  Content  Studies  11th Grade  Social  Content  Studies  11th Grade  Social  Content  Studies  11th Grade  Social  Content  Studies  11th Grade  Social  Content  Studies  11th Grade  Social  Content  Studies  11th Grade  Social  Content Studies  11th Grade  Social  Content  Studies  11th Grade  Social  Content  Studies  11th Grade  Social  Content  Studies