
Page 85 - AnnualEducationReport2018-19
P. 85
04/10/2019 Number Percent Number Percent Number Percent Number Not Not Partially Partially Proficient Proficient Advanced Proficient Proficient Proficient Proficient 38 27.7% 57 41.6% 41 29.9% 1 12,365 11.7% 44,581 42.3% 35,253 33.4% 13,194 11,522 11.0% 42,501 40.5% 38,669 36.9% 12,196 74 11.0% 348 51.6% 190 28.1% 63 77 12.2% 282 44.5% 220 34.8% 54 314 8.3% 1,112 29.3% 1,427 37.6% 940 265 6.9% 1,060 27.8% 1,588 41.6% 905 4,549 27.9% 8,860 54.3% 2,558 15.7% 345 3,834 24.2% 8,671 54.7% 3,006 19.0% 329 1,082 16.2% 3,421 51.1% 1,776
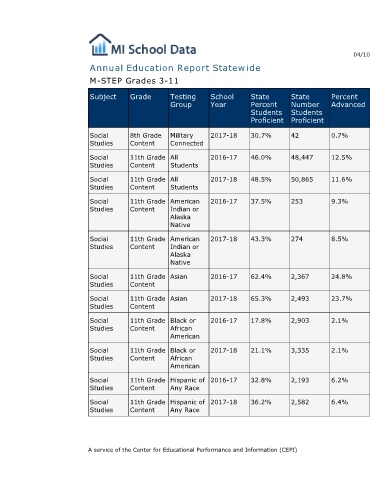
Percent Advanced 0.7% 12.5% 11.6% 9.3% 8.5% 24.8% 23.7% 2.1% 2.1% 6.2% 6.4%
State Number Students Proficient 42 48,447 50,865 253 274 2,367 2,493 2,903 3,335 2,193 2,582
State Percent Students Proficient 30.7% 46.0% 48.5% 37.5% 43.3% 62.4% 65.3% 17.8% 21.1% 32.8% 36.2%
Annual Education Report Statewide
School Year 2017-18 2016-17 2017-18 2016-17 2017-18 2016-17 2017-18 2016-17 2017-18 2016-17 2017-18
Testing Group Military Connected All Students All Students American Indian or Alaska Native American Indian or Alaska Native Asian Asian Black or African American Black or African American Hispanic of Any Race Hispanic of Any Race A service of the Center for Educational Performance and Information (CEPI)
M-STEP Grades 3-11 Grade Subject 8th Grade Social Content Studies 11th Grade Social Content Studies 11th Grade Social Content Studies 11th Grade Social Content Studies 11th Grade Social Content Studies 11th Grade Social Content Studies 11th Grade Social Content Studies 11th Grade Social Content Studies 11th Grade Social Content Studies 11th Grade Social Content Studies 11th Grade Social Content Studies