
Page 83 - AnnualEducationReport2018-19
P. 83
04/10/2019 Number Percent Number Percent Number Percent Number Not Not Partially Partially Proficient Proficient Advanced Proficient Proficient Proficient Proficient 16,967 30.5% 19,722 35.5% 15,071 27.1% 3,854 17,462 31.0% 20,916 37.1% 14,385 25.5% 3,576 22,778 46.2% 18,476 37.5% 7,190 14.6% 876 24,704 45.3% 21,405 39.3% 7,482 13.7% 884 3,774 57.3% 2,292 34.8% 479 7.3% 36 3,723 58.3% 2,272 35.6% 358 5.6% 28 41 51.9% 32 40.5% 5 6.3% 1 35 51.5% 30 44.1% 3 4.4% 0 7,571 65.8% 2,995 26.0% 808 7.0% 127 7,772 66.2% 3,153 26.9% 715 6.1
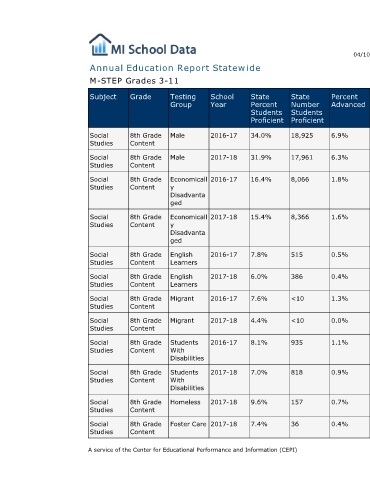
Percent Advanced 6.9% 6.3% 1.8% 1.6% 0.5% 0.4% 1.3% 0.0% 1.1% 0.9% 0.7% 0.4%
State Number Students Proficient 18,925 17,961 8,066 8,366 515 386 <10 <10 935 818 157 36
State Percent Students Proficient 34.0% 31.9% 16.4% 15.4% 7.8% 6.0% 7.6% 4.4% 8.1% 7.0% 9.6% 7.4%
Annual Education Report Statewide
School Year 2016-17 2017-18 2016-17 2017-18 2016-17 2017-18 2016-17 2017-18 2016-17 2017-18 2017-18 2017-18
Testing Group Male Male Economicall y Disadvanta ged Economicall y Disadvanta ged English Learners English Learners Migrant Migrant Students With Disabilities Students With Disabilities Homeless Foster Care A service of the Center for Educational Performance and Information (CEPI)
M-STEP Grades 3-11 Grade Subject 8th Grade Social Content Studies 8th Grade Social Content Studies 8th Grade Social Content Studies 8th Grade Social Content Studies 8th Grade Social Content Studies 8th Grade Social Content Studies 8th Grade Social Content Studies 8th Grade Social Content Studies 8th Grade Social Content Studies 8th Grade Social Content Studies 8th Grade Social Content Studies 8th Grade Social Content Studies