
Page 78 - AnnualEducationReport2018-19
P. 78
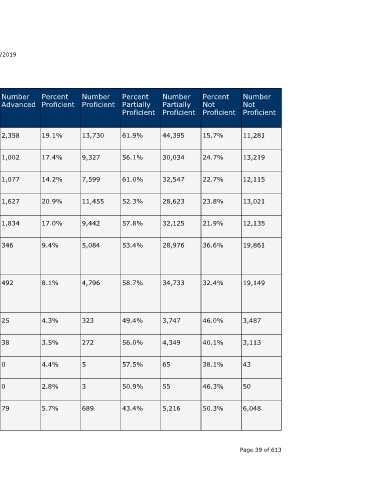
Number  Not  Proficient  11,281  13,219  12,115  13,021  12,135  19,861  19,149  3,487  3,113  43  50  6,048        Page 39 of 613


                                  Percent  Not  Proficient  15.7%  24.7%  22.7%  23.8%  21.9%  36.6%  32.4%  46.0%  40.1%  38.1%  46.3%  50.3%


                                  Number  Partially  Proficient  44,395  30,034  32,547  28,623  32,125  28,976  34,733  3,747  4,349  65  55  5,216


                                  Percent  Partially  Proficient  61.9%  56.1%  61.0%  52.3%  57.8%  53.4%  58.7%  49.4%  56.0%  57.5%  50.9%  43.4%


                                  Number  Proficient  13,730  9,327  7,599  11,455  9,442  5,084  4,796     323    272    5      3      689


                                  Percent  Proficient  19.1%  17.4%  14.2%  20.9%  17.0%  9.4%  8.1%        4.3%   3.5%   4.4%   2.8%   5.7%


                    04/10/2019    Number  Advanced  2,358  1,002  1,077  1,627  1,834  346     492          25     38     0      0      79


                                  Percent  Advanced  3.3%  1.9%  2.0%  3.0%  3.3%  0.6%        0.8%         0.3%   0.5%   0.0%   0.0%   0.7%


                                  State  Number  Students  Proficient  16,088  10,329  8,676  13,082  11,276  5,430  5,288  348  310  <10  <10  768


                                  State  Percent  Students  Proficient  22.4%  19.3%  16.3%  23.9%  20.3%  10.0%  8.9%  4.6%  4.0%  4.4%  2.8%  6.4%
                        Annual Education Report Statewide


                                  School  Year  2017-18  2016-17  2017-18  2016-17  2017-18  2016-17  2017-18  2016-17  2017-18  2016-17  2017-18  2016-17


                                  Testing  Group  White  Female  Female  Male  Male  Economicall  y  Disadvanta  ged  Economicall  y  Disadvanta  ged  English  Learners  English  Learners  Migrant  Migrant  Students  With  Disabilities A service of the Center for Educational Performance and Information (CEPI)


                             M-STEP Grades 3-11  Grade  Subject  5th Grade  Social  Content  Studies  5th Grade  Social  Content  Studies  5th Grade  Social  Content  Studies  5th Grade  Social  Content  Studies  5th Grade  Social  Content  Studies  5th Grade  Social  Content  Studies  5th Grade  Social  Content  Studies  5th Grade  Social  Content Studies  5th Grade  Social  Content  Studies  5th Grade  Social  Content  Studies  5th Grade  Social  Content  Studies  5th Grade  Social  Content Studies