
Page 76 - AnnualEducationReport2018-19
P. 76
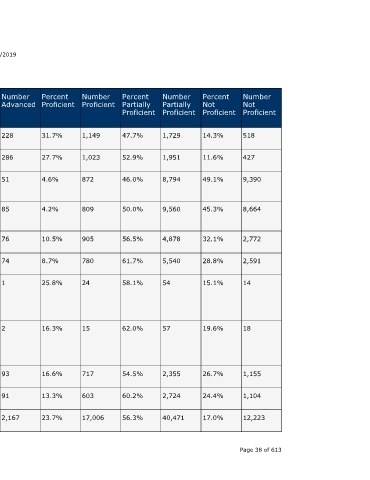
Number  Not  Proficient  518  427  9,390  8,664  2,772  2,591  14           18             1,155  1,104   12,223    Page 38 of 613


                                  Percent  Not  Proficient  14.3%  11.6%  49.1%  45.3%  32.1%  28.8%  15.1%   19.6%          26.7%  24.4%   17.0%


                                  Number  Partially  Proficient  1,729  1,951  8,794  9,560  4,878  5,540  54  57            2,355  2,724   40,471


                                  Percent  Partially  Proficient  47.7%  52.9%  46.0%  50.0%  56.5%  61.7%  58.1%  62.0%     54.5%  60.2%   56.3%


                                  Number  Proficient  1,149  1,023  872  809     905    780    24             15             717    603     17,006


                                  Percent  Proficient  31.7%  27.7%  4.6%  4.2%  10.5%  8.7%   25.8%          16.3%          16.6%  13.3%   23.7%


                    04/10/2019    Number  Advanced  228  286  51       85        76     74     1              2              93     91      2,167


                                  Percent  Advanced  6.3%  7.8%  0.3%  0.4%      0.9%   0.8%   1.1%           2.2%           2.2%   2.0%    3.0%


                                  State  Number  Students  Proficient  1,377  1,309  923  894  981  854  25   17             810    694     19,173


                                  State  Percent  Students  Proficient  38.0%  35.5%  4.8%  4.7%  11.4%  9.5%  26.9%  18.5%  18.8%  15.3%   26.7%
                        Annual Education Report Statewide


                                  School  Year  2016-17  2017-18  2016-17  2017-18  2016-17  2017-18  2016-17  2017-18       2016-17  2017-18  2016-17


                                  Testing  Group  Asian  Asian  Black or  African  American  Black or  African  American  Hispanic of  Any Race  Hispanic of  Any Race  Native  Hawaiian  or Other  Pacific  Islander  Native  Hawaiian  or Other  Pacific  Islander  Two or  More Races  Two or  More Races  White A service of the Center for Educational Performance and Information (CEPI)


                             M-STEP Grades 3-11  Grade  Subject  5th Grade  Social  Content  Studies  5th Grade  Social  Content  Studies  5th Grade  Social  Content  Studies  5th Grade  Social  Content  Studies  5th Grade  Social  Content  Studies  5th Grade  Social  Content  Studies  5th Grade  Social  Content  Studies  5th Grade  Social  Content Studies  5th Grade  Social  Content Studies  5th Grade  Social  Content  Studies  5th Grade  Social  Content  Studies