
Page 77 - AnnualEducationReport2018-19
P. 77
04/10/2019 Number Percent Number Percent Number Percent Number Not Not Partially Partially Proficient Proficient Advanced Proficient Proficient Proficient Proficient 11,281 15.7% 44,395 61.9% 13,730 19.1% 2,358 13,219 24.7% 30,034 56.1% 9,327 17.4% 1,002 12,115 22.7% 32,547 61.0% 7,599 14.2% 1,077 13,021 23.8% 28,623 52.3% 11,455 20.9% 1,627 12,135 21.9% 32,125 57.8% 9,442 17.0% 1,834 19,861 36.6% 28,976 53.4% 5,084 9.4% 346 19,149 32.4% 34,733 58.7% 4,796 8.1% 492 3,487 46.0% 3,747 49.4% 323 4.3% 25 3,113 40.1% 4,349 56.0% 272 3.5% 38
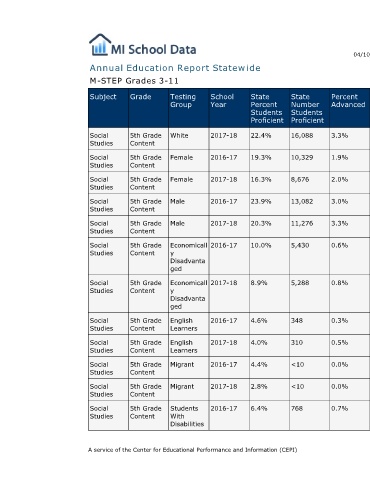
Percent Advanced 3.3% 1.9% 2.0% 3.0% 3.3% 0.6% 0.8% 0.3% 0.5% 0.0% 0.0% 0.7%
State Number Students Proficient 16,088 10,329 8,676 13,082 11,276 5,430 5,288 348 310 <10 <10 768
State Percent Students Proficient 22.4% 19.3% 16.3% 23.9% 20.3% 10.0% 8.9% 4.6% 4.0% 4.4% 2.8% 6.4%
Annual Education Report Statewide
School Year 2017-18 2016-17 2017-18 2016-17 2017-18 2016-17 2017-18 2016-17 2017-18 2016-17 2017-18 2016-17
Testing Group White Female Female Male Male Economicall y Disadvanta ged Economicall y Disadvanta ged English Learners English Learners Migrant Migrant Students With Disabilities A service of the Center for Educational Performance and Information (CEPI)
M-STEP Grades 3-11 Grade Subject 5th Grade Social Content Studies 5th Grade Social Content Studies 5th Grade Social Content Studies 5th Grade Social Content Studies 5th Grade Social Content Studies 5th Grade Social Content Studies 5th Grade Social Content Studies 5th Grade Social Content Studies 5th Grade Social Content Studies 5th Grade Social Content Studies 5th Grade Social Content Studies 5th Grade Social Content Studies