
Page 73 - AnnualEducationReport2018-19
P. 73
04/10/2019 Number Percent Number Percent Number Percent Number Not Not Partially Partially Proficient Proficient Advanced Proficient Proficient Proficient Proficient 23,897 31.9% 21,500 28.7% 18,149 24.2% 11,385 21,062 39.9% 15,461 29.3% 11,167 21.1% 5,139 20,916 39.9% 12,518 23.9% 10,714 20.4% 8,320 22,517 57.7% 9,528 24.4% 5,008 12.8% 1,993 3,279 84.2% 463 11.9% 128 3.3% 22 37 75.5% 10 20.4% 2 4.1% 0 7,300 77.7% 1,349 14.4% 498 5.3% 249 26,240 24.2% 58,657 54.2% 20,782 19.2% 2,629 24,250 22.3% 64,672 59.4% 17,041 15.7% 2,911 168 25.
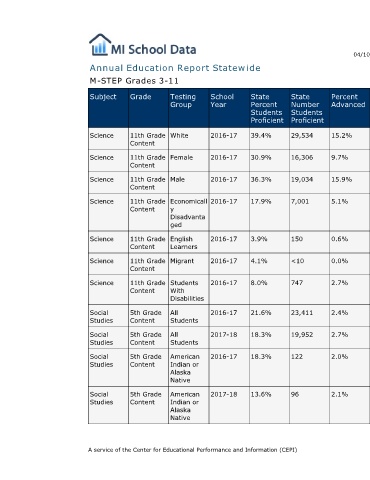
Percent Advanced 15.2% 9.7% 15.9% 5.1% 0.6% 0.0% 2.7% 2.4% 2.7% 2.0% 2.1%
State Number Students Proficient 29,534 16,306 19,034 7,001 150 <10 747 23,411 19,952 122 96
State Percent Students Proficient 39.4% 30.9% 36.3% 17.9% 3.9% 4.1% 8.0% 21.6% 18.3% 18.3% 13.6%
Annual Education Report Statewide
School Year 2016-17 2016-17 2016-17 2016-17 2016-17 2016-17 2016-17 2016-17 2017-18 2016-17 2017-18
Testing Group White Female Male Economicall y Disadvanta ged English Learners Migrant Students With Disabilities All Students All Students American Indian or Alaska Native American Indian or Alaska Native A service of the Center for Educational Performance and Information (CEPI)
M-STEP Grades 3-11 Grade Subject 11th Grade Science Content 11th Grade Science Content 11th Grade Science Content 11th Grade Science Content 11th Grade Science Content 11th Grade Science Content 11th Grade Science Content 5th Grade Social Content Studies 5th Grade Social Content Studies 5th Grade Social Content Studies 5th Grade Social Content Studies