
Page 68 - AnnualEducationReport2018-19
P. 68
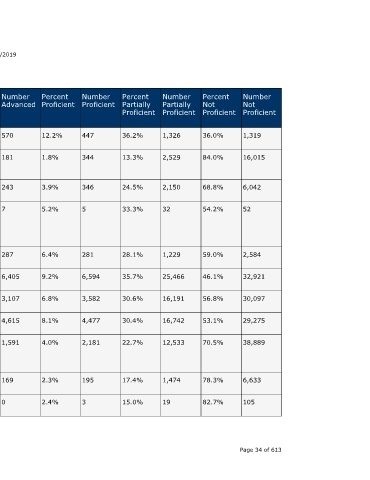
Number  Not  Proficient  1,319  16,015  6,042  52   2,584  32,921  30,097  29,275  38,889    6,633  105             Page 34 of 613


                                  Percent  Not  Proficient  36.0%  84.0%  68.8%  54.2%  59.0%  46.1%  56.8%  53.1%  70.5%      78.3%  82.7%


                                  Number  Partially  Proficient  1,326  2,529  2,150  32  1,229  25,466  16,191  16,742  12,533  1,474  19


                                  Percent  Partially  Proficient  36.2%  13.3%  24.5%  33.3%  28.1%  35.7%  30.6%  30.4%  22.7%  17.4%  15.0%


                                  Number  Proficient  447  344  346    5              281    6,594  3,582   4,477  2,181       195    3


                                  Percent  Proficient  12.2%  1.8%  3.9%  5.2%        6.4%   9.2%   6.8%    8.1%   4.0%        2.3%   2.4%


                    04/10/2019    Number  Advanced  570  181    243    7              287    6,405  3,107   4,615  1,591       169    0


                                  Percent  Advanced  15.6%  0.9%  2.8%  7.3%          6.6%   9.0%   5.9%    8.4%   2.9%        2.0%   0.0%


                                  State  Number  Students  Proficient  1,017  525  589  12  568  12,999  6,689  9,092  3,772   364    <10


                                  State  Percent  Students  Proficient  27.8%  2.8%  6.7%  12.5%  13.0%  18.2%  12.6%  16.5%  6.8%  4.3%  2.4%
                        Annual Education Report Statewide


                                  School  Year  2016-17  2016-17  2016-17  2016-17    2016-17  2016-17  2016-17  2016-17  2016-17  2016-17  2016-17


                                  Testing  Group  Asian  Black or  African  American  Hispanic of  Any Race  Native  Hawaiian  or Other  Pacific  Islander  Two or  More Races  White  Female  Male  Economicall  y  Disadvanta  ged  English  Learners  Migrant  A service of the Center for Educational Performance and Information (CEPI)


                             M-STEP Grades 3-11  Grade  Subject  4th Grade  Science  Content  4th Grade  Science  Content  4th Grade  Science  Content  4th Grade  Science  Content  4th Grade  Science  Content  4th Grade  Science  Content  4th Grade  Science  Content  4th Grade  Science  Content  4th Grade  Science  Content  4th Grade  Science  Content  4th Grade  Science  Content