
Page 65 - AnnualEducationReport2018-19
P. 65
04/10/2019 Number Percent Number Percent Number Percent Number Not Not Partially Partially Proficient Proficient Advanced Proficient Proficient Proficient Proficient 31,006 56.8% 13,819 25.3% 5,864 10.7% 3,929 4,085 62.1% 1,556 23.7% 558 8.5% 377 4,127 64.5% 1,478 23.1% 500 7.8% 296 47 58.8% 23 28.8% 9 11.3% 1 42 60.9% 16 23.2% 10 14.5% 1 9,341 81.7% 1,457 12.7% 397 3.5% 244 9,592 81.7% 1,472 12.5% 406 3.5% 264 1,149 70.1% 328 20.0% 103 6.3% 60 362 73.6% 95 19.3% 23 4.7% 12 58 42.0% 43 31.2% 23 16.7% 14 59,372 54.9% 32,933 30
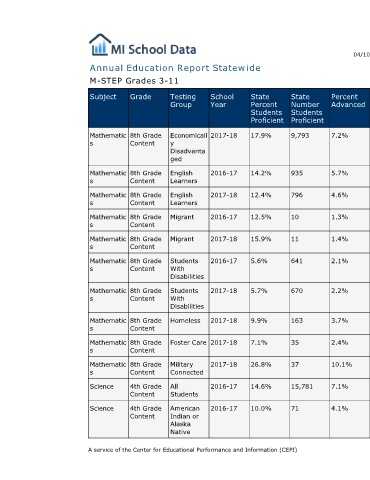
Percent Advanced 7.2% 5.7% 4.6% 1.3% 1.4% 2.1% 2.2% 3.7% 2.4% 10.1% 7.1% 4.1%
State Number Students Proficient 9,793 935 796 10 11 641 670 163 35 37 15,781 71
State Percent Students Proficient 17.9% 14.2% 12.4% 12.5% 15.9% 5.6% 5.7% 9.9% 7.1% 26.8% 14.6% 10.0%
Annual Education Report Statewide
School Year 2017-18 2016-17 2017-18 2016-17 2017-18 2016-17 2017-18 2017-18 2017-18 2017-18 2016-17 2016-17
Testing Group Economicall y Disadvanta ged English Learners English Learners Migrant Migrant Students With Disabilities Students With Disabilities Homeless Foster Care Military Connected All Students American Indian or Alaska Native A service of the Center for Educational Performance and Information (CEPI)
M-STEP Grades 3-11 Grade Subject 8th Grade Mathematic Content s 8th Grade Mathematic Content s 8th Grade Mathematic Content s 8th Grade Mathematic Content s 8th Grade Mathematic Content s 8th Grade Mathematic Content s 8th Grade Mathematic Content s 8th Grade Mathematic Content s 8th Grade Mathematic Content s 8th Grade Mathematic Content s 4th Grade Science Content 4th Grade Science Content