
Page 62 - AnnualEducationReport2018-19
P. 62
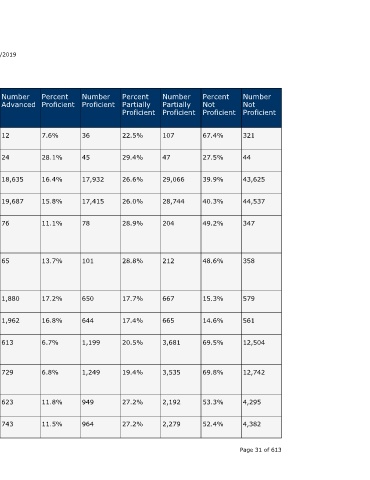
Number  Not  Proficient  321  44  43,625  44,537  347  358        579     561    12,504    12,742   4,295   4,382   Page 31 of 613


                                  Percent  Not  Proficient  67.4%  27.5%  39.9%  40.3%  49.2%  48.6%  15.3%  14.6%  69.5%    69.8%    53.3%   52.4%


                                  Number  Partially  Proficient  107  47  29,066  28,744  204  212  667     665    3,681     3,535    2,192   2,279


                                  Percent  Partially  Proficient  22.5%  29.4%  26.6%  26.0%  28.9%  28.8%  17.7%  17.4%  20.5%  19.4%  27.2%  27.2%


                                  Number  Proficient  36  45  17,932  17,415  78        101         650     644    1,199     1,249    949     964


                                  Percent  Proficient  7.6%  28.1%  16.4%  15.8%  11.1%  13.7%      17.2%   16.8%  6.7%      6.8%     11.8%   11.5%


                    04/10/2019    Number  Advanced  12  24   18,635  19,687  76         65          1,880   1,962  613       729      623     743


                                  Percent  Advanced  2.5%  15.0%  17.1%  17.8%  10.8%   8.8%        49.8%   51.2%  3.4%      4.0%     7.7%    8.9%


                                  State  Number  Students  Proficient  48  69  36,567  37,102  154  166  2,530  2,606  1,812  1,978   1,572   1,707


                                  State  Percent  Students  Proficient  10.1%  43.1%  33.5%  33.6%  21.8%  22.6%  67.0%  68.0%  10.1%  10.8%  19.5%  20.4%
                        Annual Education Report Statewide


                                  School  Year  2017-18  2017-18  2016-17  2017-18  2016-17  2017-18  2016-17  2017-18  2016-17  2017-18  2016-17  2017-18


                                  Testing  Group  Foster Care  Military  Connected  All  Students  All  Students  American  Indian or  Alaska  Native  American  Indian or  Alaska  Native  Asian  Asian  Black or  African  American  Black or  African  American  Hispanic of  Any Race  Hispanic of  Any Race A service of the Center for Educational Performance and Information (CEPI)


                             M-STEP Grades 3-11  Grade  Subject  7th Grade Mathematic  Content  s  7th Grade Mathematic  Content  s  8th Grade Mathematic  Content  s  8th Grade Mathematic  Content  s  8th Grade Mathematic  Content  s  8th Grade Mathematic  Content  s  8th Grade Mathematic  Content  s  8th Grade Mathematic  Content  s  8th Grade Mathematic  Content  s  8th Grade Mathematic  Content  s  8th Grade Mathematic  Content  s  8th Grade Mathematic  Content  s