
Page 63 - AnnualEducationReport2018-19
P. 63
04/10/2019 Number Percent Number Percent Number Percent Number Not Not Partially Partially Proficient Proficient Advanced Proficient Proficient Proficient Proficient 26 29.2% 32 36.0% 17 19.1% 14 31 33.3% 28 30.1% 13 14.0% 21 1,582 44.5% 945 26.6% 477 13.4% 548 1,782 45.6% 979 25.1% 522 13.4% 625 24,292 32.4% 21,345 28.4% 14,562 19.4% 14,881 24,681 32.8% 21,046 28.0% 13,922 18.5% 15,542 19,915 37.1% 14,844 27.7% 9,538 17.8% 9,324 20,106 37.3% 14,700 27.3% 9,328 17.3% 9,807 23,710 42.6% 14,222 25.6% 8,394 15.1% 9,311 24,431 43.3% 14,044 2
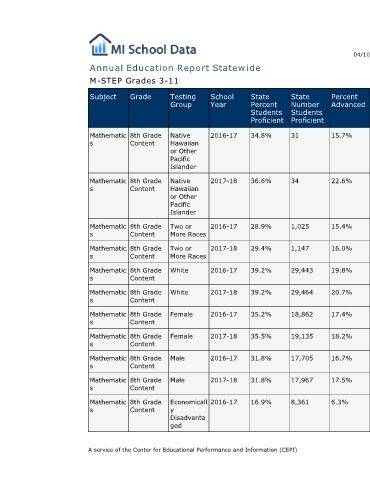
Percent Advanced 15.7% 22.6% 15.4% 16.0% 19.8% 20.7% 17.4% 18.2% 16.7% 17.5% 6.3%
State Number Students Proficient 31 34 1,025 1,147 29,443 29,464 18,862 19,135 17,705 17,967 8,361
State Percent Students Proficient 34.8% 36.6% 28.9% 29.4% 39.2% 39.2% 35.2% 35.5% 31.8% 31.8% 16.9%
Annual Education Report Statewide
School Year 2016-17 2017-18 2016-17 2017-18 2016-17 2017-18 2016-17 2017-18 2016-17 2017-18 2016-17
Testing Group Native Hawaiian or Other Pacific Islander Native Hawaiian or Other Pacific Islander Two or More Races Two or More Races White White Female Female Male Male Economicall y Disadvanta ged A service of the Center for Educational Performance and Information (CEPI)
M-STEP Grades 3-11 Grade Subject 8th Grade Mathematic Content s 8th Grade Mathematic Content s 8th Grade Mathematic Content s 8th Grade Mathematic Content s 8th Grade Mathematic Content s 8th Grade Mathematic Content s 8th Grade Mathematic Content s 8th Grade Mathematic Content s 8th Grade Mathematic Content s 8th Grade Mathematic Content s 8th Grade Mathematic Content s