
Page 60 - AnnualEducationReport2018-19
P. 60
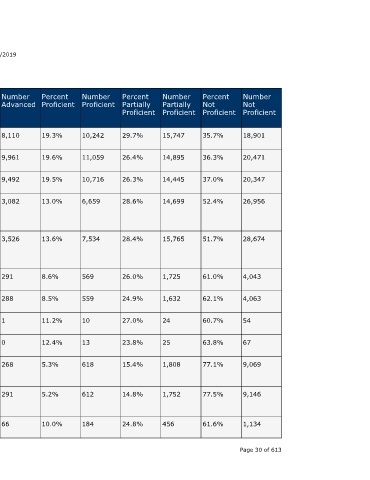
Number  Not  Proficient  18,901  20,471  20,347  26,956  28,674  4,043  4,063  54  67   9,069     9,146     1,134   Page 30 of 613


                                  Percent  Not  Proficient  35.7%  36.3%  37.0%  52.4%  51.7%  61.0%  62.1%  60.7%  63.8%  77.1%    77.5%     61.6%


                                  Number  Partially  Proficient  15,747  14,895  14,445  14,699  15,765  1,725  1,632  24  25  1,808  1,752   456


                                  Percent  Partially  Proficient  29.7%  26.4%  26.3%  28.6%  28.4%  26.0%  24.9%  27.0%  23.8%  15.4%  14.8%  24.8%


                                  Number  Proficient  10,242  11,059  10,716  6,659  7,534   569    559     10     13     618       612       184


                                  Percent  Proficient  19.3%  19.6%  19.5%  13.0%  13.6%     8.6%   8.5%    11.2%  12.4%  5.3%      5.2%      10.0%


                    04/10/2019    Number  Advanced  8,110  9,961  9,492  3,082   3,526       291    288     1      0      268       291       66


                                  Percent  Advanced  15.3%  17.7%  17.3%  6.0%   6.4%        4.4%   4.4%    1.1%   0.0%   2.3%      2.5%      3.6%


                                  State  Number  Students  Proficient  18,352  21,020  20,208  9,741  11,060  860  847  11  13  886  903      250


                                  State  Percent  Students  Proficient  34.6%  37.3%  36.7%  19.0%  19.9%  13.0%  12.9%  12.4%  12.4%  7.5%  7.7%  13.6%
                        Annual Education Report Statewide


                                  School  Year  2017-18  2016-17  2017-18  2016-17  2017-18  2016-17  2017-18  2016-17  2017-18  2016-17  2017-18  2017-18


                                  Testing  Group  Female  Male  Male  Economicall  y  Disadvanta  ged  Economicall  y  Disadvanta  ged  English  Learners  English  Learners  Migrant  Migrant  Students  With  Disabilities  Students  With  Disabilities  Homeless A service of the Center for Educational Performance and Information (CEPI)


                             M-STEP Grades 3-11  Grade  Subject  7th Grade Mathematic  Content  s  7th Grade Mathematic  Content  s  7th Grade Mathematic  Content  s  7th Grade Mathematic  Content  s  7th Grade Mathematic  Content  s  7th Grade Mathematic  Content  s  7th Grade Mathematic  Content  s  7th Grade Mathematic  Content  s  7th Grade Mathematic  Content  s  7th Grade Mathematic  Content  s  7th Grade Mathematic  Content  s  7th Grade Mathematic  Content  s