
Page 56 - AnnualEducationReport2018-19
P. 56
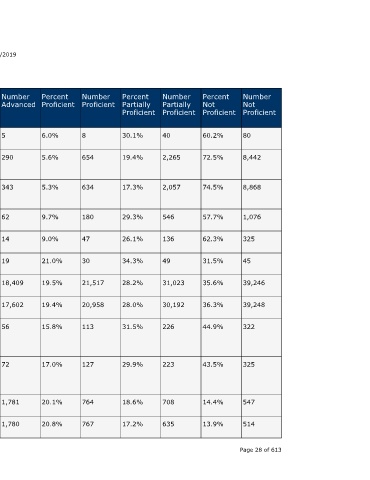
Number  Not  Proficient  80  8,442  8,868  1,076  325  45    39,246  39,248  322        325         547     514     Page 28 of 613


                                  Percent  Not  Proficient  60.2%  72.5%  74.5%  57.7%  62.3%  31.5%  35.6%  36.3%  44.9%  43.5%      14.4%   13.9%


                                  Number  Partially  Proficient  40  2,265  2,057  546  136  49  31,023  30,192  226      223         708     635


                                  Percent  Partially  Proficient  30.1%  19.4%  17.3%  29.3%  26.1%  34.3%  28.2%  28.0%  31.5%  29.9%  18.6%  17.2%


                                  Number  Proficient  8  654    634      180     47     30     21,517  20,958  113        127         764     767


                                  Percent  Proficient  6.0%  5.6%  5.3%  9.7%    9.0%   21.0%  19.5%  19.4%   15.8%       17.0%       20.1%   20.8%


                    04/10/2019    Number  Advanced  5  290      343      62      14     19     18,409  17,602  56         72          1,781   1,780


                                  Percent  Advanced  3.8%  2.5%  2.9%    3.3%    2.7%   13.3%  16.7%  16.3%   7.8%        9.6%        46.9%   48.2%


                                  State  Number  Students  Proficient  13  944  977  242  61  49  39,926  38,560  169     199         2,545   2,547


                                  State  Percent  Students  Proficient  9.8%  8.1%  8.2%  13.0%  11.7%  34.3%  36.2%  35.7%  23.6%  26.6%  67.0%  68.9%
                        Annual Education Report Statewide


                                  School  Year  2017-18  2016-17  2017-18  2017-18  2017-18  2017-18  2016-17  2017-18  2016-17  2017-18  2016-17  2017-18


                                  Testing  Group  Migrant  Students  With  Disabilities  Students  With  Disabilities  Homeless  Foster Care  Military  Connected  All  Students  All  Students  American  Indian or  Alaska  Native  American  Indian or  Alaska  Native  Asian  Asian A service of the Center for Educational Performance and Information (CEPI)


                             M-STEP Grades 3-11  Grade  Subject  6th Grade Mathematic  Content  s  6th Grade Mathematic  Content  s  6th Grade Mathematic  Content  s  6th Grade Mathematic  Content  s  6th Grade Mathematic  Content  s  6th Grade Mathematic  Content  s  7th Grade Mathematic  Content  s  7th Grade Mathematic  Content  s  7th Grade Mathematic  Content  s  7th Grade Mathematic  Content  s  7th Grade Mathematic  Content  s  7th Grade Mathematic  Content  s