
Page 58 - AnnualEducationReport2018-19
P. 58
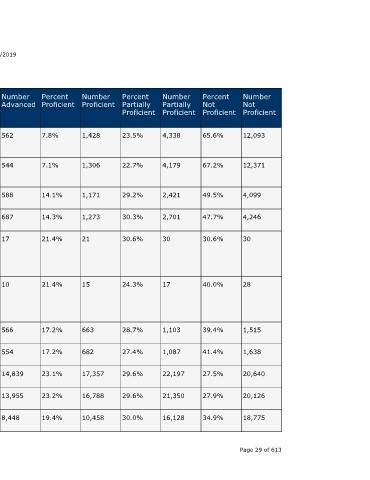
Number  Not  Proficient  12,093  12,371  4,099  4,246  30     28             1,515  1,638  20,640  20,126  18,775   Page 29 of 613


                                  Percent  Not  Proficient  65.6%  67.2%  49.5%  47.7%  30.6%   40.0%          39.4%  41.4%  27.5%  27.9%   34.9%


                                  Number  Partially  Proficient  4,338  4,179  2,421  2,701  30  17            1,103  1,087  22,197  21,350  16,128


                                  Percent  Partially  Proficient  23.5%  22.7%  29.2%  30.3%  30.6%  24.3%     28.7%  27.4%  29.6%  29.6%   30.0%


                                  Number  Proficient  1,428  1,306  1,171  1,273  21            15             663    682    17,357  16,788  10,458


                                  Percent  Proficient  7.8%  7.1%  14.1%  14.3%  21.4%          21.4%          17.2%  17.2%  23.1%  23.2%   19.4%


                    04/10/2019    Number  Advanced  562  544      588    687     17             10             566    554    14,839  13,955  8,448


                                  Percent  Advanced  3.1%  3.0%   7.1%   7.7%    17.3%          14.3%          14.7%  14.0%  19.8%  19.3%   15.7%


                                  State  Number  Students  Proficient  1,990  1,850  1,759  1,960  38  25      1,229  1,236  32,196  30,743  18,906


                                  State  Percent  Students  Proficient  10.8%  10.1%  21.2%  22.0%  38.8%  35.7%  31.9%  31.2%  42.9%  42.6%  35.1%
                        Annual Education Report Statewide


                                  School  Year  2016-17  2017-18  2016-17  2017-18  2016-17     2017-18        2016-17  2017-18  2016-17  2017-18  2016-17


                                  Testing  Group  Black or  African  American  Black or  African  American  Hispanic of  Any Race  Hispanic of  Any Race  Native  Hawaiian  or Other  Pacific  Islander  Native  Hawaiian  or Other  Pacific  Islander  Two or  More Races  Two or  More Races  White  White  Female A service of the Center for Educational Performance and Information (CEPI)


                             M-STEP Grades 3-11  Grade  Subject  7th Grade Mathematic  Content  s  7th Grade Mathematic  Content  s  7th Grade Mathematic  Content  s  7th Grade Mathematic  Content  s  7th Grade Mathematic  Content  s  7th Grade Mathematic  Content  s  7th Grade Mathematic  Content  s  7th Grade Mathematic  Content  s  7th Grade Mathematic  Content  s  7th Grade Mathematic  Content  s  7th Grade Mathematic  Content  s