
Page 67 - AnnualEducationReport2018-19
P. 67
04/10/2019 Number Percent Number Percent Number Percent Number Not Not Partially Partially Proficient Proficient Advanced Proficient Proficient Proficient Proficient 1,319 36.0% 1,326 36.2% 447 12.2% 570 16,015 84.0% 2,529 13.3% 344 1.8% 181 6,042 68.8% 2,150 24.5% 346 3.9% 243 52 54.2% 32 33.3% 5 5.2% 7 2,584 59.0% 1,229 28.1% 281 6.4% 287 32,921 46.1% 25,466 35.7% 6,594 9.2% 6,405 30,097 56.8% 16,191 30.6% 3,582 6.8% 3,107 29,275 53.1% 16,742 30.4% 4,477 8.1% 4,615 38,889 70.5% 12,533 22.7% 2,181 4.0% 1,591 6,633 78.3% 1,474 17.
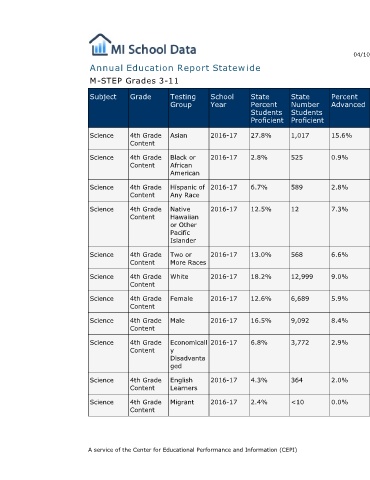
Percent Advanced 15.6% 0.9% 2.8% 7.3% 6.6% 9.0% 5.9% 8.4% 2.9% 2.0% 0.0%
State Number Students Proficient 1,017 525 589 12 568 12,999 6,689 9,092 3,772 364 <10
State Percent Students Proficient 27.8% 2.8% 6.7% 12.5% 13.0% 18.2% 12.6% 16.5% 6.8% 4.3% 2.4%
Annual Education Report Statewide
School Year 2016-17 2016-17 2016-17 2016-17 2016-17 2016-17 2016-17 2016-17 2016-17 2016-17 2016-17
Testing Group Asian Black or African American Hispanic of Any Race Native Hawaiian or Other Pacific Islander Two or More Races White Female Male Economicall y Disadvanta ged English Learners Migrant A service of the Center for Educational Performance and Information (CEPI)
M-STEP Grades 3-11 Grade Subject 4th Grade Science Content 4th Grade Science Content 4th Grade Science Content 4th Grade Science Content 4th Grade Science Content 4th Grade Science Content 4th Grade Science Content 4th Grade Science Content 4th Grade Science Content 4th Grade Science Content 4th Grade Science Content