
Page 71 - AnnualEducationReport2018-19
P. 71
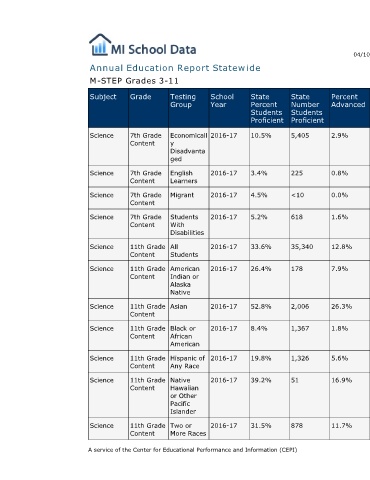
04/10/2019    Number  Percent Number  Percent Number  Percent Number  Not  Not Partially Partially Proficient Proficient Advanced  Proficient Proficient Proficient Proficient  36,377  70.7%  9,671  18.8%  3,901  7.6%  1,504  5,650  85.3%  746  11.3%  169  2.6%  56  75 85.2%  9 10.2%  4  4.5%  0  10,097  85.0%  1,158  9.8%  425  3.6%  193  41,978  39.9%  27,979  26.6%  21,881  20.8%  13,459  305  45.3%  191  28.3%  125  18.5%  53  1,018  26.8%  773  20.4%  1,006  26.5%  1,000  11,923 73.2%  2,992 18.4%  1,067  6.6%  300  3,645  54.5%  1,722  25.7%  953  14.2%  373  53  40.8%  26  20.0%  29  22.3%  22  1,13
                                  Percent  Advanced  2.9%  0.8%   0.0%   1.6%      12.8%  7.9%         26.3%  1.8%      5.6%   16.9%          11.7%


                                  State  Number  Students  Proficient  5,405  225  <10  618  35,340  178  2,006  1,367  1,326  51             878


                                  State  Percent  Students  Proficient  10.5%  3.4%  4.5%  5.2%  33.6%  26.4%  52.8%  8.4%  19.8%  39.2%      31.5%
                        Annual Education Report Statewide


                                  School  Year  2016-17    2016-17  2016-17  2016-17  2016-17  2016-17  2016-17  2016-17  2016-17  2016-17    2016-17


                                  Testing  Group  Economicall  y  Disadvanta  ged  English  Learners  Migrant  Students  With  Disabilities  All  Students  American  Indian or  Alaska  Native  Asian  Black or  African  American  Hispanic of  Any Race  Native  Hawaiian  or Other  Pacific  Islander  Two or  More Races A service of the Center for Educational Performance and Information (CEPI)

                             M-STEP Grades 3-11  Grade  Subject  7th Grade  Science  Content  7th Grade  Science  Content  7th Grade Science  Content  7th Grade  Science  Content  11th Grade  Science  Content  11th Grade  Science  Content  11th Grade  Science  Content  11th Grade Science  Content  11th Grade  Science  Content  11th Grade  Science  Content  11th Grade  Science  Content