
Page 75 - AnnualEducationReport2018-19
P. 75
04/10/2019 Number Percent Number Percent Number Percent Number Not Not Partially Partially Proficient Proficient Advanced Proficient Proficient Proficient Proficient 518 14.3% 1,729 47.7% 1,149 31.7% 228 427 11.6% 1,951 52.9% 1,023 27.7% 286 9,390 49.1% 8,794 46.0% 872 4.6% 51 8,664 45.3% 9,560 50.0% 809 4.2% 85 2,772 32.1% 4,878 56.5% 905 10.5% 76 2,591 28.8% 5,540 61.7% 780 8.7% 74 14 15.1% 54 58.1% 24 25.8% 1 18 19.6% 57 62.0% 15 16.3% 2 1,155 26.7% 2,355 54.5% 717 16.6% 93 1,104 24.4% 2,724 60.2% 603 13.3% 91 12,223 17.0% 40,4
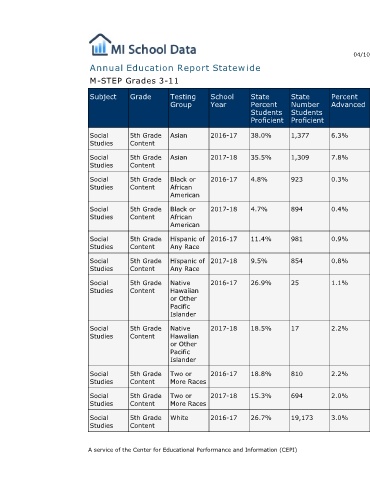
Percent Advanced 6.3% 7.8% 0.3% 0.4% 0.9% 0.8% 1.1% 2.2% 2.2% 2.0% 3.0%
State Number Students Proficient 1,377 1,309 923 894 981 854 25 17 810 694 19,173
State Percent Students Proficient 38.0% 35.5% 4.8% 4.7% 11.4% 9.5% 26.9% 18.5% 18.8% 15.3% 26.7%
Annual Education Report Statewide
School Year 2016-17 2017-18 2016-17 2017-18 2016-17 2017-18 2016-17 2017-18 2016-17 2017-18 2016-17
Testing Group Asian Asian Black or African American Black or African American Hispanic of Any Race Hispanic of Any Race Native Hawaiian or Other Pacific Islander Native Hawaiian or Other Pacific Islander Two or More Races Two or More Races White A service of the Center for Educational Performance and Information (CEPI)
M-STEP Grades 3-11 Grade Subject 5th Grade Social Content Studies 5th Grade Social Content Studies 5th Grade Social Content Studies 5th Grade Social Content Studies 5th Grade Social Content Studies 5th Grade Social Content Studies 5th Grade Social Content Studies 5th Grade Social Content Studies 5th Grade Social Content Studies 5th Grade Social Content Studies 5th Grade Social Content Studies