
Page 79 - AnnualEducationReport2018-19
P. 79
04/10/2019 Number Percent Number Percent Number Percent Number Not Not Partially Partially Proficient Proficient Advanced Proficient Proficient Proficient Proficient 6,048 48.6% 5,720 46.0% 595 4.8% 79 867 41.9% 1,120 54.2% 73 3.5% 8 219 39.8% 300 54.5% 26 4.7% 5 25 15.0% 99 59.3% 40 24.0% 3 33,434 30.6% 41,482 38.0% 28,286 25.9% 5,967 34,134 31.0% 43,809 39.8% 26,533 24.1% 5,715 242 34.3% 271 38.4% 163 23.1% 29 267 36.5% 312 42.6% 132 18.0% 21 555 14.7% 1,200 31.8% 1,529 40.6% 485 531 13.9% 1,387 36.3% 1,439 37.6% 468 10,610 59
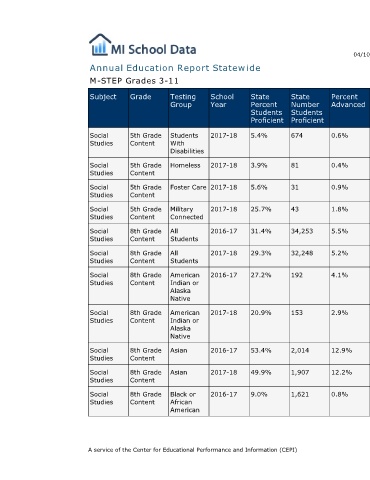
Percent Advanced 0.6% 0.4% 0.9% 1.8% 5.5% 5.2% 4.1% 2.9% 12.9% 12.2% 0.8%
State Number Students Proficient 674 81 31 43 34,253 32,248 192 153 2,014 1,907 1,621
State Percent Students Proficient 5.4% 3.9% 5.6% 25.7% 31.4% 29.3% 27.2% 20.9% 53.4% 49.9% 9.0%
Annual Education Report Statewide
School Year 2017-18 2017-18 2017-18 2017-18 2016-17 2017-18 2016-17 2017-18 2016-17 2017-18 2016-17
Testing Group Students With Disabilities Homeless Foster Care Military Connected All Students All Students American Indian or Alaska Native American Indian or Alaska Native Asian Asian Black or African American A service of the Center for Educational Performance and Information (CEPI)
M-STEP Grades 3-11 Grade Subject 5th Grade Social Content Studies 5th Grade Social Content Studies 5th Grade Social Content Studies 5th Grade Social Content Studies 8th Grade Social Content Studies 8th Grade Social Content Studies 8th Grade Social Content Studies 8th Grade Social Content Studies 8th Grade Social Content Studies 8th Grade Social Content Studies 8th Grade Social Content Studies