
Page 81 - AnnualEducationReport2018-19
P. 81
04/10/2019 Number Percent Number Percent Number Percent Number Not Not Partially Partially Proficient Proficient Advanced Proficient Proficient Proficient Proficient 10,689 58.9% 6,037 33.3% 1,311 7.2% 107 3,260 40.4% 3,255 40.3% 1,370 17.0% 184 3,359 40.2% 3,486 41.8% 1,306 15.6% 198 15 16.7% 45 50.0% 24 26.7% 6 22 23.7% 40 43.0% 27 29.0% 4 1,168 32.9% 1,369 38.6% 849 23.9% 159 1,320 33.8% 1,522 39.0% 882 22.6% 179 17,584 23.4% 29,599 39.5% 22,876 30.5% 4,958 17,946 23.9% 31,025 41.3% 21,436 28.5% 4,738 16,467 30.7% 21,760 40.6%
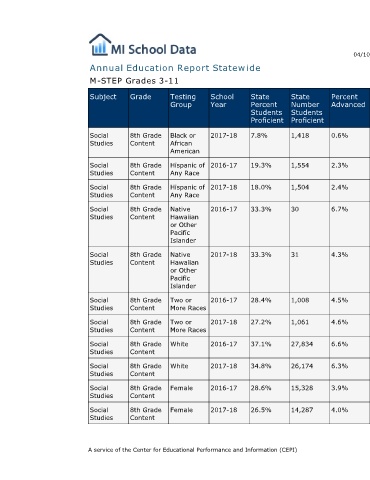
Percent Advanced 0.6% 2.3% 2.4% 6.7% 4.3% 4.5% 4.6% 6.6% 6.3% 3.9% 4.0%
State Number Students Proficient 1,418 1,554 1,504 30 31 1,008 1,061 27,834 26,174 15,328 14,287
State Percent Students Proficient 7.8% 19.3% 18.0% 33.3% 33.3% 28.4% 27.2% 37.1% 34.8% 28.6% 26.5%
Annual Education Report Statewide
School Year 2017-18 2016-17 2017-18 2016-17 2017-18 2016-17 2017-18 2016-17 2017-18 2016-17 2017-18
Testing Group Black or African American Hispanic of Any Race Hispanic of Any Race Native Hawaiian or Other Pacific Islander Native Hawaiian or Other Pacific Islander Two or More Races Two or More Races White White Female Female A service of the Center for Educational Performance and Information (CEPI)
M-STEP Grades 3-11 Grade Subject 8th Grade Social Content Studies 8th Grade Social Content Studies 8th Grade Social Content Studies 8th Grade Social Content Studies 8th Grade Social Content Studies 8th Grade Social Content Studies 8th Grade Social Content Studies 8th Grade Social Content Studies 8th Grade Social Content Studies 8th Grade Social Content Studies 8th Grade Social Content Studies