
Page 74 - AnnualEducationReport2018-19
P. 74
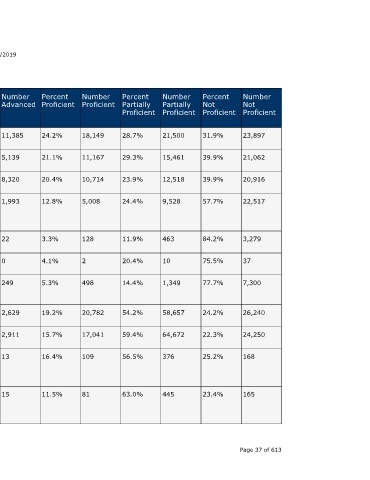
Number  Not  Proficient  23,897  21,062  20,916  22,517  3,279  37  7,300  26,240  24,250  168    165               Page 37 of 613


                                  Percent  Not  Proficient  31.9%  39.9%  39.9%  57.7%  84.2%  75.5%  77.7%  24.2%  22.3%  25.2%    23.4%


                                  Number  Partially  Proficient  21,500  15,461  12,518  9,528  463  10  1,349  58,657  64,672  376  445


                                  Percent  Partially  Proficient  28.7%  29.3%  23.9%  24.4%  11.9%  20.4%  14.4%  54.2%  59.4%  56.5%  63.0%


                                  Number  Proficient  18,149  11,167  10,714  5,008  128  2    498       20,782  17,041  109        81


                                  Percent  Proficient  24.2%  21.1%  20.4%  12.8%  3.3%  4.1%  5.3%      19.2%  15.7%  16.4%        11.5%


                    04/10/2019    Number  Advanced  11,385  5,139  8,320  1,993  22     0      249       2,629  2,911  13           15


                                  Percent  Advanced  15.2%  9.7%  15.9%  5.1%    0.6%   0.0%   2.7%      2.4%   2.7%   2.0%         2.1%


                                  State  Number  Students  Proficient  29,534  16,306  19,034  7,001  150  <10  747  23,411  19,952  122  96


                                  State  Percent  Students  Proficient  39.4%  30.9%  36.3%  17.9%  3.9%  4.1%  8.0%  21.6%  18.3%  18.3%  13.6%
                        Annual Education Report Statewide


                                  School  Year  2016-17  2016-17  2016-17  2016-17  2016-17  2016-17  2016-17  2016-17  2017-18  2016-17  2017-18


                                  Testing  Group  White  Female  Male  Economicall  y  Disadvanta  ged  English  Learners  Migrant  Students  With  Disabilities  All  Students  All  Students  American  Indian or  Alaska  Native  American  Indian or  Alaska  Native A service of the Center for Educational Performance and Information (CEPI)


                             M-STEP Grades 3-11  Grade  Subject  11th Grade  Science  Content  11th Grade  Science  Content  11th Grade  Science  Content  11th Grade  Science  Content  11th Grade  Science  Content  11th Grade  Science  Content  11th Grade Science  Content  5th Grade  Social  Content  Studies  5th Grade  Social  Content  Studies  5th Grade  Social  Content  Studies  5th Grade  Social  Content  Studies