
Page 87 - AnnualEducationReport2018-19
P. 87
04/10/2019 Number Percent Number Percent Number Percent Number Not Not Partially Partially Proficient Proficient Advanced Proficient Proficient Proficient Proficient 17 13.0% 51 38.9% 40 30.5% 23 8 9.0% 41 46.1% 31 34.8% 9 318 11.4% 1,228 44.0% 917 32.9% 328 317 10.7% 1,269 43.0% 1,052 35.6% 316 6,011 8.0% 29,561 39.4% 28,345 37.8% 11,078 5,926 8.0% 27,720 37.2% 30,650 41.2% 10,123 6,100 11.5% 24,698 46.7% 17,448 33.0% 4,640 5,307 10.2% 23,244 44.5% 19,535 37.4% 4,168 6,265 11.9% 19,883 37.9% 17,805 33.9% 8,554 6,215 11.8% 19,257 36.6% 1
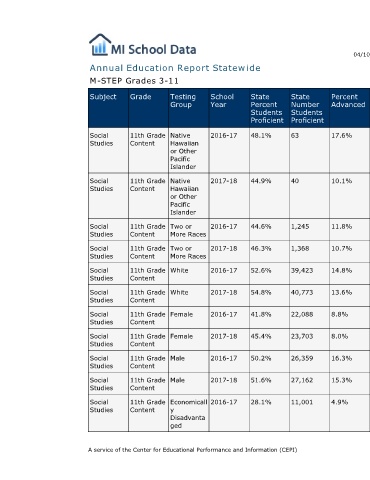
Percent Advanced 17.6% 10.1% 11.8% 10.7% 14.8% 13.6% 8.8% 8.0% 16.3% 15.3% 4.9%
State Number Students Proficient 63 40 1,245 1,368 39,423 40,773 22,088 23,703 26,359 27,162 11,001
State Percent Students Proficient 48.1% 44.9% 44.6% 46.3% 52.6% 54.8% 41.8% 45.4% 50.2% 51.6% 28.1%
Annual Education Report Statewide
School Year 2016-17 2017-18 2016-17 2017-18 2016-17 2017-18 2016-17 2017-18 2016-17 2017-18 2016-17
Testing Group Native Hawaiian or Other Pacific Islander Native Hawaiian or Other Pacific Islander Two or More Races Two or More Races White White Female Female Male Male Economicall y Disadvanta ged A service of the Center for Educational Performance and Information (CEPI)
M-STEP Grades 3-11 Grade Subject 11th Grade Social Content Studies 11th Grade Social Content Studies 11th Grade Social Content Studies 11th Grade Social Content Studies 11th Grade Social Content Studies 11th Grade Social Content Studies 11th Grade Social Content Studies 11th Grade Social Content Studies 11th Grade Social Content Studies 11th Grade Social Content Studies 11th Grade Social Content Studies