
Page 76 - How to Write and Publish a Scientific Paper, 8th Edition 8th Edition
P. 76
Page 61
Page 61
Chapter 13
How to Design Effective Tables
A tabular presentation of data is often the heart or, better, the brain, of a scientific paper.
—Peter Morgan
When to Use Tables
Before proceeding to the "how to" of tables, let us first examine the question "whether to."
As a rule, do not construct a table unless repetitive data must be presented. There are two reasons for this general rule.
First, it is simply not good science to regurgitate reams of data just because you have them in your laboratory
notebooks; only samples and breakpoints need be given. Second, the cost of publishing tables is very high compared
with that of text, and all of us involved with the generation and publication of scientific literature should worry about
the cost.
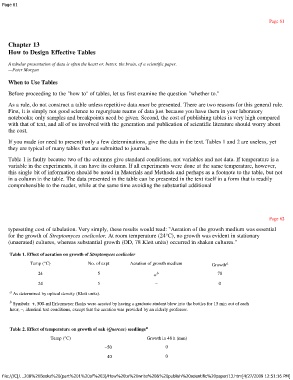
If you made (or need to present) only a few determinations, give the data in the text. Tables 1 and 2 are useless, yet
they are typical of many tables that are submitted to journals.
Table 1 is faulty because two of the columns give standard conditions, not variables and not data. If temperature is a
variable in the experiments, it can have its column. If all experiments were done at the same temperature, however,
this single bit of information should be noted in Materials and Methods and perhaps as a footnote to the table, but not
in a column in the table. The data presented in the table can be presented in the text itself in a form that is readily
comprehensible to the reader, while at the same time avoiding the substantial additional
Page 62
typesetting cost of tabulation. Very simply, these results would read: "Aeration of the growth medium was essential
for the growth of Streptomyces coelicolor. At room temperature (24°C), no growth was evident in stationary
(unaerated) cultures, whereas substantial growth (OD, 78 Klett units) occurred in shaken cultures."
Table 1. Effect of aeration on growth of Streptomyces coelicolor
Temp (°C) No. of expt Aeration of growth medium Growth a
24 5 + b 78
24 5 – 0
a As determined by optical density (Klett units).
b Symbols: +, 500-ml Erlenmeyer flasks were aerated by having a graduate student blow into the bottles for 15 min out of each
hour; –, identical test conditions, except that the aeration was provided by an elderly professor.
Table 2. Effect of temperature on growth of oak (Quercus) seedlings a
Temp (°C) Growth in 48 h (mm)
–50 0
–40 0
file:///C|/...208%20Books%20(part%201%20of%203)/How%20to%20write%20&%20publish%20scientific%20paper/13.htm[4/27/2009 12:51:16 PM]