
Page 77 - How to Write and Publish a Scientific Paper, 8th Edition 8th Edition
P. 77
Page 61
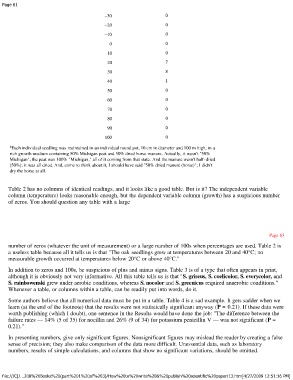
–30 0
–20 0
–10 0
0 0
10 0
20 7
30 8
40 1
50 0
60 0
70 0
80 0
90 0
100 0
a Each individual seedling was maintained in an individual round pot, 10 cm in diameter and 100 m high, in a
rich growth medium containing 50% Michigan peat and 50% dried horse manure. Actually, it wasn't "50%
Michigan"; the peat was 100% "Michigan," all of it coming from that state. And the manure wasn't half-dried
(50%); it was all dried. And, come to think about it, I should have said "50% dried manure (horse)"; I didn't
dry the horse at all.
Table 2 has no columns of identical readings, and it looks like a good table. But is it? The independent variable
column (temperature) looks reasonable enough, but the dependent variable column (growth) has a suspicious number
of zeros. You should question any table with a large
Page 63
number of zeros (whatever the unit of measurement) or a large number of 100s when percentages are used. Table 2 is
a useless table because all it tells us is that "The oak seedlings grew at temperatures between 20 and 40°C; no
measurable growth occurred at temperatures below 20°C or above 40°C."
In addition to zeros and 100s, be suspicious of plus and minus signs. Table 3 is of a type that often appears in print,
although it is obviously not very informative. All this table tells us is that "S. griseus, S. coelicolor, S. everycolor, and
S. rainbowenski grew under aerobic conditions, whereas S. nocolor and S. greenicus required anaerobic conditions."
Whenever a table, or columns within a table, can be readily put into words, do it.
Some authors believe that all numerical data must be put in a table. Table 4 is a sad example. It gets sadder when we
learn (at the end of the footnote) that the results were not statistically significant anyway (P = 0.21). If these data were
worth publishing (which I doubt), one sentence in the Results would have done the job: "The difference between the
failure rates — 14% (5 of 35) for nocillin and 26% (9 of 34) for potassium penicillin V — was not significant (P =
0.21)."
In presenting numbers, give only significant figures. Nonsignificant figures may mislead the reader by creating a false
sense of precision; they also make comparison of the data more difficult. Unessential data, such as laboratory
numbers, results of simple calculations, and columns that show no significant variations, should be omitted.
file:///C|/...208%20Books%20(part%201%20of%203)/How%20to%20write%20&%20publish%20scientific%20paper/13.htm[4/27/2009 12:51:16 PM]