Page 229 - BCML AR 2019-20
P. 229

BALRAMPUR CHINI MILLS LIMITED


            Notes forming part of the Standalone Financial Statements


             Note No. : 36 Other disclosures (contd.)

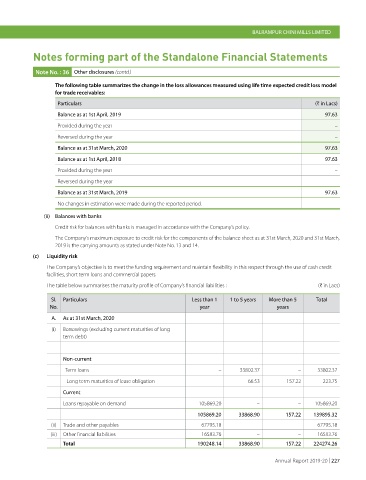
                   The following table summarizes the change in the loss allowances measured using life time expected credit loss model
                   for trade receivables:
                    Particulars                                                                         (H in Lacs)
                    Balance as at 1st April, 2019                                                          97.63

                    Provided during the year                                                                   –
                    Reversed during the year                                                                   –
                    Balance as at 31st March, 2020                                                         97.63

                    Balance as at 1st April, 2018                                                          97.63
                    Provided during the year                                                                   –
                    Reversed during the year                                                                   –
                    Balance as at 31st March, 2019                                                         97.63

                    No changes in estimation were made during the reported period.
               (ii)  Balances with banks

                   Credit risk for balances with banks is managed in accordance with the Company’s policy.
                   The Company’s maximum exposure to credit risk for the components of the balance sheet as at 31st March, 2020 and 31st March,
                   2019 is the carrying amounts as stated under Note No. 13 and 14.
            (c)   Liquidity risk

                The Company’s objective is to meet the funding requirement and maintain flexibility in this respect through the use of cash credit
                facilities, short term loans and commercial papers.
                The table below summarises the maturity profile of Company’s financial liabilities :           (H in Lacs)

                  Sl.  Particulars                             Less than 1   1 to 5 years  More than 5   Total
                 No.                                              year                     years
                  A.  As at 31st March, 2020
                  (i)  Borrowings (excluding current maturities of long -
                      term debt)


                      Non-current
                        Term loans                                      –      33802.37            –     33802.37

                         Long term maturities of lease obligation                 66.53        157.22     223.75
                      Current
                      Loans repayable on demand                   105869.20          –             –     105869.20

                                                                 105869.20     33868.90        157.22   139895.32
                  (ii)  Trade and other payables                   67795.18          –             –     67795.18
                 (iii)  Other financial liabilities                16583.76          –             –     16583.76
                      Total                                      190248.14     33868.90        157.22   224274.26


                                                                                          Annual Report 2019-20 | 227
   224   225   226   227   228   229   230   231   232   233   234