
Page 230 - BCML AR 2019-20
P. 230
FINANCIAL STATEMENTS
Notes forming part of the Standalone Financial Statements
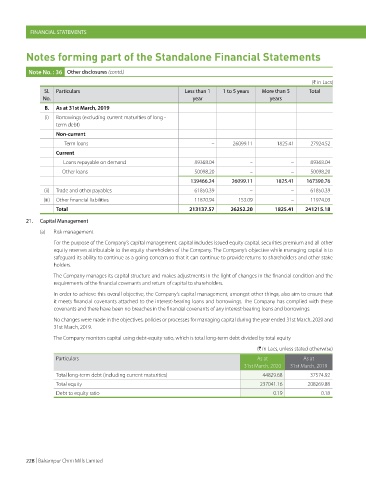
Note No. : 36 Other disclosures (contd.)
(H in Lacs)
Sl. Particulars Less than 1 1 to 5 years More than 5 Total
No. year years
B. As at 31st March, 2019
(i) Borrowings (excluding current maturities of long -
term debt)
Non-current
Term loans – 26099.11 1825.41 27924.52
Current
Loans repayable on demand 89368.04 – – 89368.04
Other loans 50098.20 – – 50098.20
139466.24 26099.11 1825.41 167390.76
(ii) Trade and other payables 61850.39 – – 61850.39
(iii) Other financial liabilities 11820.94 153.09 – 11974.03
Total 213137.57 26252.20 1825.41 241215.18
21. Capital Management
(a) Risk management
For the purpose of the Company’s capital management, capital includes issued equity capital, securities premium and all other
equity reserves attributable to the equity shareholders of the Company. The Company’s objective while managing capital is to
safeguard its ability to continue as a going concern so that it can continue to provide returns to shareholders and other stake
holders.
The Company manages its capital structure and makes adjustments in the light of changes in the financial condition and the
requirements of the financial covenants and return of capital to shareholders.
In order to achieve this overall objective, the Company’s capital management, amongst other things, also aim to ensure that
it meets financial covenants attached to the interest-bearing loans and borrowings. The Company has complied with these
covenants and there have been no breaches in the financial covenants of any interest-bearing loans and borrowings.
No changes were made in the objectives, policies or processes for managing capital during the year ended 31st March, 2020 and
31st March, 2019.
The Company monitors capital using debt-equity ratio, which is total long-term debt divided by total equity
(H in Lacs, unless stated otherwise)
Particulars As at As at
31st March, 2020 31st March, 2019
Total long-term debt (including current maturities) 44829.68 37574.92
Total equity 237041.16 208269.88
Debt to equity ratio 0.19 0.18
228 | Balrampur Chini Mills Limited