
Page 260 - BCML AR 2019-20
P. 260
FINANCIAL STATEMENTS
Notes forming part of the Consolidated Financial Statements
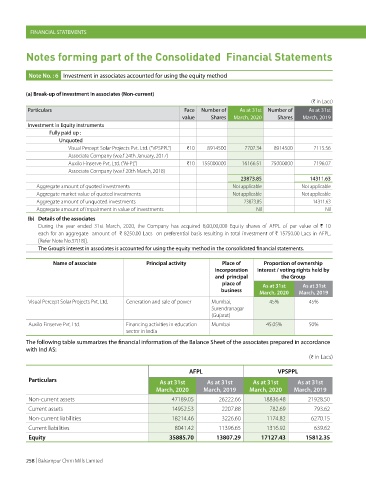
Note No. : 6 Investment in associates accounted for using the equity method
(a) Break-up of investment in associates (Non-current)
(H in Lacs)
Particulars Face Number of As at 31st Number of As at 31st
value Shares March, 2020 Shares March, 2019
Investment in Equity instruments
Fully paid up :
Unquoted
Visual Percept Solar Projects Pvt. Ltd. (“VPSPPL”) H10 8914500 7707.34 8914500 7115.56
Associate Company (w.e.f 24th January, 2017)
Auxilo Finserve Pvt. Ltd. (“AFPL”) H10 155000000 16166.51 75000000 7196.07
Associate Company (w.e.f 20th March, 2018)
23873.85 14311.63
Aggregate amount of quoted investments Not applicable Not applicable
Aggregate market value of quoted investments Not applicable Not applicable
Aggregate amount of unquoted investments 23873.85 14311.63
Aggregate amount of impairment in value of investments Nil Nil
(b) Details of the associates
During the year ended 31st March, 2020, the Company has acquired 8,00,00,000 Equity shares of AFPL of par value of H 10
each for an aggregate amount of H 8250.00 Lacs on preferential basis resulting in total investment of H 15750.00 Lacs in AFPL.
[Refer Note No.37(18)].
The Group’s interest in associates is accounted for using the equity method in the consolidated financial statements.
Name of associate Principal activity Place of Proportion of ownership
incorporation interest / voting rights held by
and principal the Group
place of As at 31st As at 31st
business March, 2020 March, 2019
Visual Percept Solar Projects Pvt. Ltd. Generation and sale of power Mumbai, 45% 45%
Surendranagar
(Gujarat)
Auxilo Finserve Pvt. Ltd. Financing activities in education Mumbai 45.05% 50%
sector in India
The following table summarizes the financial information of the Balance Sheet of the associates prepared in accordance
with Ind AS:
(H in Lacs)
AFPL VPSPPL
Particulars As at 31st As at 31st As at 31st As at 31st
March, 2020 March, 2019 March, 2020 March, 2019
Non-current assets 47189.05 26222.66 18836.48 21928.50
Current assets 14952.53 2207.88 782.69 793.62
Non-current liabilities 18214.46 3226.60 1174.82 6270.15
Current liabilities 8041.42 11396.65 1316.92 639.62
Equity 35885.70 13807.29 17127.43 15812.35
258 | Balrampur Chini Mills Limited