
Page 261 - BCML AR 2019-20
P. 261
BALRAMPUR CHINI MILLS LIMITED
Notes forming part of the Consolidated Financial Statements
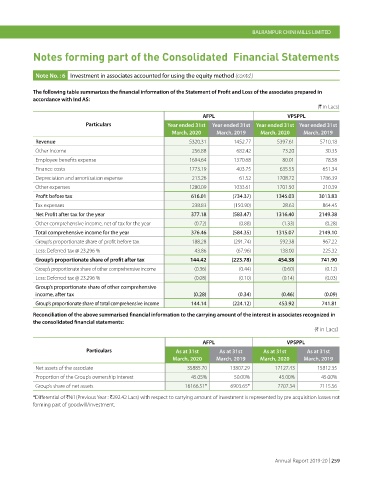
Note No. : 6 Investment in associates accounted for using the equity method (contd.)
The following table summarizes the financial information of the Statement of Profit and Loss of the associates prepared in
accordance with Ind AS:
(H in Lacs)
AFPL VPSPPL
Particulars Year ended 31st Year ended 31st Year ended 31st Year ended 31st
March, 2020 March, 2019 March, 2020 March, 2019
Revenue 5320.31 1452.77 5397.61 5710.18
Other Income 256.88 682.42 73.20 30.35
Employee benefits expense 1694.64 1370.68 80.01 78.58
Finance costs 1773.19 403.75 635.55 651.34
Depreciation and amortisation expense 213.26 61.52 1708.72 1786.39
Other expenses 1280.09 1033.61 1701.50 210.39
Profit before tax 616.01 (734.37) 1345.03 3013.83
Tax expenses 238.83 (150.90) 28.63 864.45
Net Profit after tax for the year 377.18 (583.47) 1316.40 2149.38
Other comprehensive income, net of tax for the year (0.72) (0.88) (1.33) (0.28)
Total comprehensive income for the year 376.46 (584.35) 1315.07 2149.10
Group’s proportionate share of profit before tax 188.28 (291.74) 592.38 967.22
Less: Deferred tax @ 23.296 % 43.86 (67.96) 138.00 225.32
Group’s proportionate share of profit after tax 144.42 (223.78) 454.38 741.90
Group’s proportionate share of other comprehensive income (0.36) (0.44) (0.60) (0.12)
Less: Deferred tax @ 23.296 % (0.08) (0.10) (0.14) (0.03)
Group’s proportionate share of other comprehensive
income, after tax (0.28) (0.34) (0.46) (0.09)
Group’s proportionate share of total comprehensive income 144.14 (224.12) 453.92 741.81
Reconciliation of the above summarised financial information to the carrying amount of the interest in associates recognized in
the consolidated financial statements:
(H in Lacs)
AFPL VPSPPL
Particulars As at 31st As at 31st As at 31st As at 31st
March, 2020 March, 2019 March, 2020 March, 2019
Net assets of the associate 35885.70 13807.29 17127.43 15812.35
Proportion of the Group’s ownership interest 45.05% 50.00% 45.00% 45.00%
Group’s share of net assets 16166.51* 6903.65* 7707.34 7115.56
*Differential of HNil (Previous Year : H292.42 Lacs) with respect to carrying amount of investment is represented by pre acquisition losses not
forming part of goodwill/investment.
Annual Report 2019-20 | 259