
Page 34 - Winter 2018 Journal
P. 34
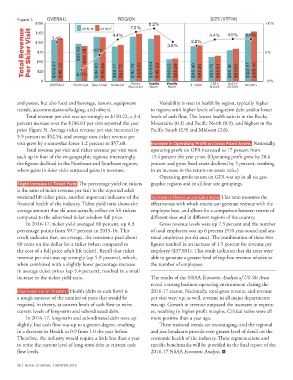
Figure 3 OVERALL REGION SIZE (VTF/H)
$150 3.4% 2015/16 2016/17 4.4% 7.0% 8.2% 4.4% 4.5% 4.5% +10%
ěɁɽƃȢ Ąljʤljȶʍlj Āljɨ ČȟȈljɨ řȈɰȈɽ $100 $96.59 $90.78 -1.0% 3.6% 2.2% 0%
$125
$75
$50
$25
0 $106.61 $110.22 -6.0% $114.80 $113.64 $89.77 $93.72 $114.79 $122.82 $109.64 $118.59 $56.53 $58.59 $90.40 $92.36 $62.75 $65.51 $80.16 $83.80 $122.97 $128.46 -10%
OVERALL Northeast Southeast Midwest Rocky ĀƃƺȈˎƺ ĀƃƺȈˎƺ 0-7,500 7,501- 10,001- 20,001+
Mountain South North 10,000 20,000
and passes, but also food and beverage, lessons, equipment Variability is seen in health by region, typically higher
rentals, accommodations/lodging, and others). in regions with higher levels of long-term debt and/or lower
Total revenue per visit was up strongly to $110.22, a 3.4 levels of cash flow. The lowest health ratio is in the Rocky
percent increase over the $106.61 per visit reported the year Mountains (0.3) and Pacific North (0.9), and highest in the
prior (figure 3). Average ticket revenue per visit increased by Pacific South (2.9) and Midwest (2.6).
5.9 percent to $52.54, and average non-ticket revenue per
visit grew by a somewhat lesser 1.2 percent to $57.68. ȶƺɨljƃɰlj Ȉȶ ÝɥljɨƃɽȈȶǼ ĀɨɁˎɽ Ɂȶ {ɨɁɰɰ yȈʯljǁ ɰɰljɽɰӝ Nationally,
Total revenue per visit and ticket revenue per visit were operating profit on GFA increased to 17 percent from
each up in four of the six geographic regions; interestingly, 13.4 percent the year prior. (Operating profit grew by 20.6
the figures declined in the Northeast and Southeast regions, percent and gross fixed assets declined by 5 percent, resulting
where gains in skier visits outpaced gains in revenues. in an increase in the return-on-assets ratio.)
Operating profit return on GFA was up in all six geo-
ČȢȈǼȃɽ ȶƺɨljƃɰlj Ȉȶ ěȈƺȟljɽ ťȈljȢǁӝ The percentage yield on tickets graphic regions and in all four size groupings.
is the ratio of ticket revenue per visit to the reported adult
weekend lift ticket price, another important indicator of the Increase in Revenue per Employee. This ratio measures the
financial health of the industry. Ticket yield ratio shows the effectiveness with which resorts can generate revenue with the
average amount that ski areas actually collect on lift tickets employee base, and allows for a comparison between resorts of
compared to the advertised ticket window full price. different sizes and in different regions of the country.
In 2016-17, ticket yield averaged 60 percent, up 0.3 Gross revenue levels were up 7.5 percent and the number
percentage points from 59.7 percent in 2015-16. This of total employees was up 6 percent (910 year-round and sea-
result indicates that, on average, the consumer paid about sonal employees per ski area). The combination of these two
60 cents on the dollar for a ticket (when compared to figures resulted in an increase of 1.5 percent for revenue per
the cost of a full price adult lift ticket). Recall that ticket employee ($37,851). This result indicates that ski areas were
revenue per visit was up strongly (up 5.9 percent), which, able to generate a greater level of top-line revenue relative to
when combined with a slightly lower percentage increase the number of employees.
in average ticket prices (up 5.4 percent), resulted in a small
increase in the ticket yield ratio. The results of the NSAA Economic Analysis of US Ski Areas
reveal a strong business operating environment during the
Improvement in “Health.” Health (debt to cash flow) is 2016-17 season. Nationally, total gross revenue and revenue
a rough measure of the number of years that would be per visit were up; as well, revenue in all major departments
required, in theory, at current levels of cash flow to retire was up. Growth in revenue outpaced the increases in expens-
current levels of long-term and subordinated debt. es, resulting in higher profit margins. Critical ratios were all
In 2016-17, long-term and subordinated debt were up more positive than a year ago.
slightly, but cash flow was up to a greater degree, resulting These national trends are encouraging, and the regional
in a decrease in Health to 0.9 from 1.0 the year before. and size breakouts provide even greater level of detail on the
Therefore, the industry would require a little less than a year economic health of the industry. These segmentations and
to retire the current level of long-term debt at current cash specific benchmarks will be provided in the final report of the
flow levels. 2016-17 NSAA Economic Analysis.
32 | NSAA JOURNAL | WINTER 2018