
Page 33 - Winter 2018 Journal
P. 33
Increase in Departmental Revenue. Average revenue ĀɨɁˎɽ ÃƃɨǼȈȶɰ
nationally for all major departments rose from 2015-16,
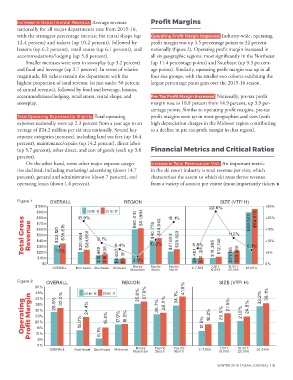
with the strongest percentage increase for rental shops (up ÝɥljɨƃɽȈȶǼ ĀɨɁˎɽ ÃƃɨǼȈȶ ȴɥɨɁʤljǁӝ Industry-wide, operating
12.4 percent) and tickets (up 10.2 percent), followed by profit margin was up 3.5 percentage points to 32 percent
lessons (up 6.2 percent), retail stores (up 6.1 percent), and nationally (figure 2). Operating profit margin increased in
accommodations/lodging (up 5.8 percent). all six geographic regions, most significantly in the Northeast
Smaller increases were seen in snowplay (up 3.2 percent) (up 11.4 percentage points) and Southeast (up 9.3 percent-
and food and beverage (up 2.7 percent). In terms of relative age points). Similarly, operating profit margin was up in all
magnitude, lift tickets remain the department with the four size groups, with the smaller two cohorts exhibiting the
highest proportion of total revenue (at just under 50 percent largest percentage point gain over the 2015-16 season.
of annual revenue), followed by food and beverage, lessons,
accommodations/lodging, retail stores, rental shops, and ĀɨljӸěƃʯ ĀɨɁˎɽ ÃƃɨǼȈȶ ȶƺɨljƃɰljǁӝ Nationally, pre-tax profit
snowplay. margin rose to 18.8 percent from 14.9 percent, up 3.9 per-
centage points. Similar to operating profit margins, pre-tax
Total Operating Expenses Up Slightly. Total operating profit margins were up in most geographies and sizes (with
expenses nationally were up 2.3 percent from a year ago to an high depreciation charges in the Midwest region contributing
average of $24.2 million per ski area nationally. Several key to a decline in pre-tax profit margin in that region).
expense categories increased, including land use fees (up 16.4
percent), maintenance/repairs (up 14.2 percent), direct labor
(up 5.7 percent), other direct, and cost of goods (each up 3.8 yȈȶƃȶƺȈƃȢ ÃljɽɨȈƺɰ ƃȶǁ :ɨȈɽȈƺƃȢ ĄƃɽȈɁɰ
percent).
On the other hand, some other major expense catego- Increase in Total Revenue per Visit. An important metric
ries declined, including marketing/ advertising (down 14.7 in the ski resort industry is total revenue per visit, which
percent), general and administrative (down 7 percent), and characterizes the extent to which ski areas derive revenue
operating leases (down 1.6 percent). from a variety of sources per visitor (most importantly tickets
Figure 1 OVERALL REGION SIZE (VTF/H)
$100m 22.6% +25%
2015/16
$90m 18.9% 2016/17 $60,010 $61,994 18.1% $89,523 $94,972 +20%
ěɁɽƃȢ {ɨɁɰɰ Ąljʤljȶʍlj $70m $33,120 $35,615 $20,984 $24,950 9.1% 6.4% 10.2% $44,943 $21,603 $25,523 6.8% 11.2% 6.1% +15%
$80m
$40,776
$60m
$50m
+10%
$40m
$30m
$20m
$10m 7.5% $15,440 $16,838 $8,637 $9,191 3.3% $9,481 $10,124 $10,395 $12,740 $21,195 $23,568 +5%
$0 0%
7,501-
Rocky
OVERALL Northeast Southeast Midwest Mountain Pacific Pacific 0-7,500 10,000 10,001- 20,001+
South
20,000
North
Figure 2 OVERALL REGION SIZE (VTF/H)
50%
45% 28.5% 32.0% 2015/16 2016/17 35.6% 37.6% 34.1% 41.8% 33.2% 36.1%
ÝɥljɨƃɽȈȶǼ ĀɨɁˎɽ ÃƃɨǼȈȶ 20% 13.0% 24.4% 15.4% 17.9% 18.5% 26.7% 28.0% 12.5% 18.2% 20.0% 27.5% 21.0% 24.8%
40%
35%
30%
25%
15%
10%
5%
0% 6.1%
7,501-
Rocky
OVERALL Northeast Southeast Midwest Mountain Pacific Pacific 0-7,500 10,000 10,001- 20,001+
20,000
North
South
WINTER 2018 | NSAA JOURNAL | 31