
Page 31 - NSAA_Winter_2017_WEB
P. 31
64618
985165
16876
85465
14686
985165
54654
16876
621646
85465
18498
14686
61354
54654
681814
621646
65464
18498
985165
618985
61354
16876
165168 64618 64618
76854 681814 85465
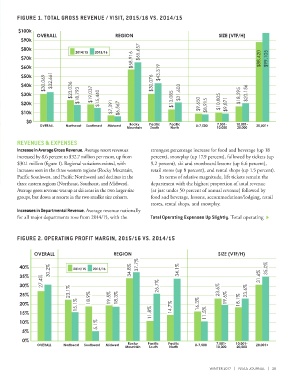
65464 14686 FIGURE 1. TOTAL GROSS REVENUE / VISIT, 2015/16 VS. 2014/15
NSAA ECONOMIC 618985 54654 $100k
165168
621646
ANALYSIS RESULTS: 76854 18498 $90k OVERALL REGION SIZE (VTF/H)
61354
$80k
A QUICK OVERVIEW OF 681814 $70k 2014/15 2015/16 $58,916 $65,657 $88,420 $99,105
65464
618985
$60k
THE 2015/16 SEASON 165168 $50k $43,319
76854
$40k $30,069 $32,661 $30,076
$30k $23,036 $18,793 $19,037 $21,603 $18,295 $20,156
$20k $15,440 $13,085 $9,650 $8,915 $10,805 $9,871
$10k $7,391 $6,567
64618 $0
Rocky
985165 OVERALL Northeast Southeast Midwest Mountain Pacific Pacific 0-7,500 7,501- 10,001- 20,001+
South
20,000
10,000
North
16876
85465 REVENUES & EXPENSES
14686 Increase in Average Gross Revenue. Average resort revenues strongest percentage increase for food and beverage (up 18
54654 increased by 8.6 percent to $32.7 million per resort, up from percent), snowplay (up 17.9 percent), followed by tickets (up
621646 $30.1 million (figure 1). Regional variations existed, with 9.2 percent), ski and snowboard lessons (up 6.6 percent),
18498 increases seen in the three western regions (Rocky Mountain, retail stores (up 8 percent), and rental shops (up 1.5 percent).
61354 Pacific Southwest, and Pacific Northwest) and declines in the In terms of relative magnitude, lift tickets remain the
681814 three eastern regions (Northeast, Southeast, and Midwest). department with the highest proportion of total revenue
65464 Average gross revenue was up at ski areas in the two larger size (at just under 50 percent of annual revenue) followed by
618985 groups, but down at resorts in the two smaller size cohorts. food and beverage, lessons, accommodations/lodging, retail
165168 stores, rental shops, and snowplay.
76854 Increases in Departmental Revenue. Average revenue nationally
for all major departments rose from 2014/15, with the Total Operating Expenses Up Slightly. Total operating
FIGURE 2. OPERATING PROFIT MARGIN, 2015/16 VS. 2014/15
OVERALL REGION SIZE (VTF/H)
40% 2014/15 2015/16 34.8% 34.8% 37.7% 37.7%
35% 30.2% 30.2% 34.1% 34.1% 31.6% 31.6% 35.0% 35.0%
30% 27.4% 27.4%
25% 23.1% 23.1% 19.5% 19.5% 18.3% 18.3% 26.7% 26.7% 23.6% 23.6% 19.6% 19.6% 23.6% 23.6%
20% 15.1% 15.1% 18.9% 18.9% 14.7% 14.7% 18.1% 18.1%
15% 11.8% 11.8% 16.3% 16.3% 11.5% 11.5%
10% 5.1% 5.1%
5%
0%
OVERALL Northeast Southeast Midwest Rocky Pacific Pacific 0-7,500 7,501- 10,001- 20,001+
Mountain South North 10,000 20,000
WINTER 2017 | NSAA JOURNAL | 29