
Page 32 - NSAA_Winter_2017_WEB
P. 32
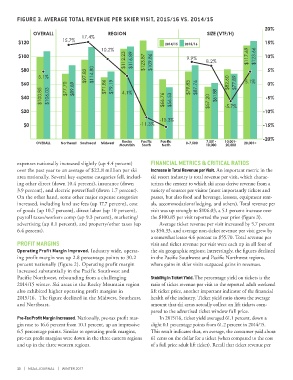
FIGURE 3. AVERAGE TOTAL REVENUE PER SKIER VISIT, 2015/16 VS. 2014/15

                                                                                                                20%
               OVERALL             17.4%      REGION                                   SIZE (VTF/H)
         $120              15.7%                                      2014/15  2015/16                          15%
                                           10.2%
                                                     $112.23  $116.89  $123.87  $109.86  8.2%
         $100                                                                  9.9%                      $117.69  $123.66  10%

          $80                                                                                                    5%
                 5.1%                $97.82  $114.80
          $60                $77.70  $89.89  $71.86  $79.19                     $79.83  $87.76   $82.60  $77.89  5.1%  0%
                  $100.85  $106.03                  4.1%
          $40                                                        $66.76  $56.53     $57.20       $61.88     -5%

          $20                                                                                  -5.7%           -10%
                                                                    -15.3%
                                                                    -15.3%
           $0                                              -11.3%                                              -15%

                                                                                                               -20%
                                                                                       7,501-
                                                    Rocky
                OVERALL   Northeast  Southeast  Midwest  Mountain  Pacific  Pacific  0-7,500  10,000  10,001-  20,001+
                                                                     North
                                                                                               20,000
                                                            South
        expenses nationally increased slightly (up 4.4 percent)   FINANCIAL METRICS & CRITICAL RATIOS
        over the past year to an average of $22.8 million per ski   Increase in Total Revenue per Visit. An important metric in the
        area nationally. Several key expense categories fell, includ-  ski resort industry is total revenue per visit, which charac-
        ing other direct (down 10.4 percent), insurance (down   terizes the ezxtent to which ski areas derive revenue from a
        3.9 percent), and electric power/fuel (down 1.7 percent).   variety of sources per visitor (most importantly tickets and
        On the other hand, some other major expense categories   passes, but also food and beverage, lessons, equipment rent-
        increased, including land use fees (up 17.7 percent), cost   als, accommodations/lodging, and others). Total revenue per
        of goods (up 10.7 percent), direct labor (up 10 percent),   visit was up strongly to $106.03, a 5.1 percent increase over
        payroll taxes/workers comp (up 9.3 percent), marketing/  the $100.85 per visit reported the year prior (figure 3).
        advertising (up 8.1 percent), and property/other taxes (up   Average ticket revenue per visit increased by 5.7 percent
        6.4 percent).                                           to $50.33, and average non-ticket revenue per visit grew by
                                                                a somewhat lesser 4.6 percent to $55.70. Total revenue per
        PROFIT MARGINS                                          visit and ticket revenue per visit were each up in all four of

        Operating Profit Margin Improved. Industry wide, operat-  the six geographic regions; interestingly, the figures declined
        ing profit margin was up 2.8 percentage points to 30.2   in the Pacific Southwest and Pacific Northwest regions,
        percent nationally (figure 2). Operating profit margin    where gains in skier visits outpaced gains in revenues.
        increased substantially in the Pacific Southwest and
        Pacific Northwest, rebounding from a challenging        Stability in Ticket Yield. The percentage yield on tickets is the
        2014/15 winter. Ski areas in the Rocky Mountain region    ratio of ticket revenue per visit to the reported adult weekend
        also exhibited higher operating profit margins in       lift ticket price, another important indicator of the financial
        2015/16.  The figure declined in the Midwest, Southeast,   health of the industry. Ticket yield ratio shows the average
        and Northeast.                                          amount that ski areas actually collect on lift tickets com-
                                                                pared to the advertised ticket window full price.
        Pre-Tax Profit Margin Increased. Nationally, pre-tax profit mar-  In 2015/16, ticket yield averaged 61.1 percent, down a
        gin rose to 16.6 percent from 10.1 percent, up an impressive   slight 0.1 percentage points from 61.2 percent in 2014/15.
        6.5 percentage points. Similar to operating profit margins,   This result indicates that, on average, the consumer paid about
        pre-tax profit margins were down in the three eastern regions   61 cents on the dollar for a ticket (when compared to the cost
        and up in the three western regions.                    of a full price adult lift ticket). Recall that ticket revenue per


        30  |  NSAA JOURNAL  |  WINTER 2017