
Page 12 - PowerPoint 簡報
P. 12
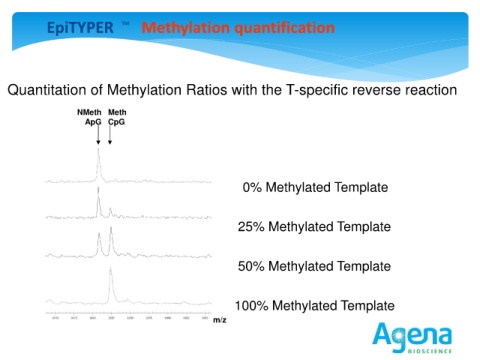
EpiTYPER               TM   Methylation quantification


   Quantitation of Methylation Ratios with the T-specific reverse reaction


                        NMeth    Meth
                          ApG    CpG


                                 Plate1 C14: Sum of 2 of 2 Spectra
           1.0                                                           0% Methylated Template
           0.9
           0.8
           0.7
           0.6
           0.5
           0.4
           0.3
           0.2                   Plate1 B14: Sum of 3 of 3 Spectra
           1.50                                                         25% Methylated Template
           0.1
           0.0
           1.25
                3150  3175  3200  3225  3250  3275  3300  3325  3350
           1.00
           0.75
           0.50
                                                                        50% Methylated Template
           0.25
           0.00
                 3150  3175  3200  3225  3250  3275  3300  3325  3350
                                                                       100% Methylated Template

                                                                 m/z


                                                                                                                              12