Page 13 - PowerPoint 簡報
P. 13

TM
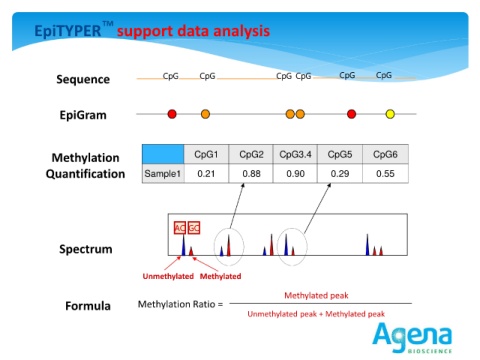
           EpiTYPER    support data analysis


                  Sequence                        CpG        CpG                    CpG  CpG           CpG        CpG


                   EpiGram


                Methylation                                CpG1          CpG2        CpG3.4        CpG5          CpG6

               Quantification               Sample1         0.21          0.88         0.90         0.29          0.55


                                                     AC GC

                   Spectrum


                                            Unmethylated     Methylated


                                                                                      Methylated peak
                     Formula              Methylation Ratio =
                                                                           Unmethylated peak + Methylated peak


                                                                                                                              13
   8   9   10   11   12   13   14