
Page 24 - AR DPBM-2016--SMALL
P. 24
Ikhtisar Utama Laporan Manajemen Profil Dana Pensiun Bank Mandiri
Key Financial Highlights Management Report Dana Pensiun Bank Mandiri Profile
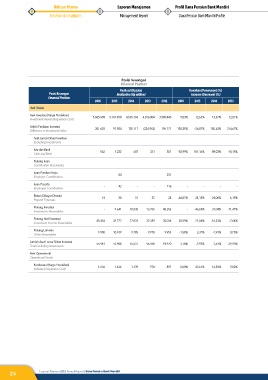
Posisi Keuangan
Financial Position
Realisasi (Rp juta) Kenaikan (Penurunan) (%)
Posisi Keuangan Realization (Rp million) Increase (Decrease) (%)
Financial Position
2016 2015 2014 2013 2012 2016 2015 2014 2013
Aset | Assets
Aset Investasi (Harga Perolehan)
Investment Assets (Acquisition Cost) 5.605.909 5.141.818 4.565.103 4.016.004 3.585.443 9,03% 12,63% 13,67% 12,01%
Selisih Penilaian Investasi 201.625 91.504 125.117 (224.962) 196.171 120,35% -26,87% 155,62% 214,67%
Difference in Investment Value
Aset Lancar Diluar Investasi
Excluding Investments
Kas dan Bank 562 1.222 607 321 357 -53,99% 101,16% 89,02% -10,15%
Cash and Bank
Piutang Iuran
Contribution Receivables
Iuran Pemberi Kerja - 84 - - 231 - - - -
Employer Contributions
Iuran Peserta
Employee Contributions - 42 - - 116 - - - -
Beban Dibayar Dimuka 14 38 31 25 24 -64,87% 24,12% 24,06% 6,18%
Prepaid Expenses
Piutang Investasi
Investments Receivables - 9.641 18.038 13.765 48.253 - -46,55% 31,04% -71,47%
Piutang Hasil Investasi 45.418 32.772 27.076 32.359 35.036 38,59% 21,04% -16,33% -7,64%
Investment Income Receivables
Piutang Lain-lain
Other Receivables 9.950 10.109 9.785 9.978 9.953 -1,58% 3,32% -1,93% 0,25%
Jumlah Aset Lancar Diluar Investasi
Total Excluding Investments 55.944 53.908 55.537 56.448 93.970 3,78% -2,93% -1,61% -39,93%
Aset Operasional
Operational Assets
Kendaraan (Harga Perolehan)
Vehicles (Acquisition Cost) 1.636 1.636 1.139 978 897 0,00% 43,61% 16,50% 9,02%
24 Laporan Tahunan 2016 Annual Report | Dana Pensiun Bank Mandiri