
Page 345 - statbility for masters and mates
P. 345
Bending of beams 333
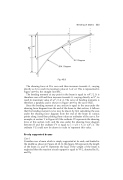
Fig. 40.9
The shearing force at B is zero and then increases towards A, varying directly as X, to reach its maximum value at A of wl. This is represented in Figure 40.9 by the straight line BFC.
The bending moment at any point in the beam is equal to wX2=2. It is therefore zero at B and then increases towards A, varying directly as X2, to reach its maximum value of wl2=2 at A. The curve of bending moments is therefore a parabola and is shown in Figure 40.9 by the curve BGE.
Since the bending moment at any section is equal to the area under the shearing force diagram from the end of the beam to that section, it follows that the bending moment curve may be drawn by ®rst calculating the area under the shearing force diagram from the end of the beam to various points along it and then plotting these values as ordinates of the curve. For example, at section Y in Figure 40.9 the ordinate YF represents the shearing force at this section (wX), and the area under the shearing force diagram between B and the ordinate FY is equal to 12 wX X or wX2=2. The ordinate YG could now be drawn to scale to represent this value.
Freely supported beams
Case I
Consider now a beam which is simply supported at its ends, and loaded in the middle as shown in Figure 40.10. In this ®gure AB represents the length of the beam (l), and W represents the load. If the weight of the beam is neglected then the reaction at each support is equal to W/2, denoted by RA and RB.
