
Page 348 - statbility for masters and mates
P. 348
336 Ship Stability for Masters and Mates
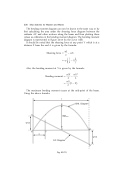
The bending moment diagram can now be drawn in the same way or by ®rst calculating the area under the shearing force diagram between the ordinate AC and other sections along the beam and then plotting these values as ordinates on the bending moment diagram. The bending moment diagram is represented in Figure 40.13 by the curve AEB.
It should be noted that the shearing force at any point Y which is at a distance X from the end A is given by the formula:
Shearing force wl wX 2 l
w 2 X
Also, the bending moment at Y is given by the formula:
Bending moment wlX wX2 22
wX l X 2
The maximum bending moment occurs at the mid-point of the beam. Using the above formula:
Fig. 40.13
