Page 373 - NUMINO_WB_5B
P. 373
189_G5U32_G6U24_WB˜ ˙—» ¿º 2011.7.4 2:20 PM ˘ ` 7
189-B4-1
Comparing Line Graphs
1. Answer the questions.
Example
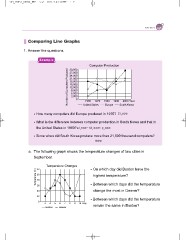
Computer Production
Number of Computers Produced 30,000 1960 1970 1980 1990 2000 Year
27,000
24,000
21,000
18,000
15,000
12,000
9,000
6,000
3,000
0
United States Europe South Korea
How many computers did Europe produced in 1970?
What is the difference between computer production in South Korea and that in
the United States in 1990?
Since when did South Korea produce more than 21,000 thousand computers?
a. The following graph shows the temperature changes of two cities in
September.
Temperature Changes On which day did Boston have the
highest temperature?
32
Between which days did the temperature
Temperature ( 30 change the most in Denver?
28 Between which days did the temperature
remain the same in Boston?
26
24
22
0 3 4 5 6 7 8 9 10 Day
Boston Denver


