Page 374 - NUMINO_WB_5B
P. 374
189_G5U32_G6U24_WB˜ ˙—» ¿º 2011.7.4 2:20 PM ˘ ` 8
189-B4-2
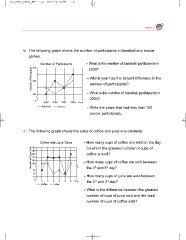
b. The following graph shows the number of participants in baseball and soccer
games.
Number of Participants Number of Participants What is the number of baseball participants in
2000?
300
Which year has the largest difference in the
200
number of participants?
100 What is the number of baseball participants in
2004?
0 1998 2000 2002 2004 Year
Write the years that had less than 150
Baseball Soccer soccer participants.
c. The following graph shows the sales of coffee and juice in a cafeteria.
Number of Cups Sold Coffee and Juice Sales How many cups of coffee are sold on the day
on which the greatest number of cups of
200 coffee is sold?
190
180 How many cups of coffee are sold between
170 the 4th and 5th day?
160
150 How many cups of juice are sold between
the 2nd and 3rd day?
30
What is the difference between the greatest
20 number of cups of juice sold and the least
number of cups of coffee sold?
10
0 1 2 3 4 5 6 Day
Coffee Juice


