Page 379 - NUMINO_WB_5B
P. 379
189_G5U32_G6U24_WB˜ ˙—» ¿º 2011.7.4 2:20 PM ˘ ` 13
189-B7-1
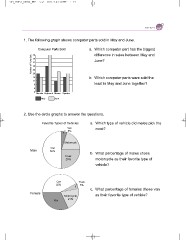
1. The following graph shows computer parts sold in May and June.
Number of Parts Sold Computer Parts Sold a. Which computer part has the biggest
difference in sales between May and
40 June?
36
32 b. Which computer parts were sold the
28 least in May and June together?
24
20
16
12
8
4
0 Monitor Keyboard Mouse Speaker
May June
2. Use the circle graphs to answer the questions.
Favorite Types of Vehicles a. Which type of vehicle did males pick the
most?
Van
5%
Male Car Motorcycle b. What percentage of males chose
50% motorcycle as their favorite type of
Truck vehicle?
25%
Car Truck
42% 5%
Female Motorcycle c. What percentage of females chose van
Van 21% as their favorite type of vehicle?


