Page 380 - NUMINO_WB_5B
P. 380
189_G5U32_G6U24_WB˜ ˙—» ¿º 2011.7.4 2:21 PM ˘ ` 14
189-B7-2
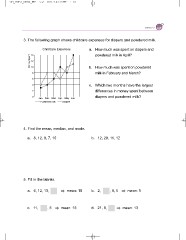
3. The following graph shows childcare expenses for diapers and powdered milk.
Childcare Expenses a. How much was spent on diapers and
powdered milk in April?
Money Spent 14
b. How much was spent on powdered
12 milk in February and March?
10 c. Which two months have the largest
differences in money spent between
8 diapers and powdered milk?
6
4
2
0 Jan. Feb. Mar. Apr. May Jun.
Powdered milk Diapers
4. Find the mean, median, and mode.
a. 8, 12, 8, 7, 10 b. 12, 29, 11, 12
5. Fill in the blanks. mean: 10 b. 2, , 8, 5 mean: 5
a. 6, 12, 13,
c. 11, , 5 mean: 15 d. 21, 8, mean: 13


